INVESTOR PRESENTATION, DATED DECEMBER 14, 2022
Published on December 14, 2022
Exhibit 99.2
NET Power PIPE Presentation December 2022
Disclaimer (1/2) This presentation is being furnished solely for the purpose of considering a potential transaction involving Rice Acquisition Corp. II (“RONI”) and NET Power, LLC (“NET Power”). By accepting this presentation, the recipient acknowledges and agrees that all of the information contained herein is confidential, that the recipient will distribute, disclose and use such information only for such purpose and that the recipient shall not distribute, disclose or use such information for any other purpose other than the evaluation of the potential transaction. ANY SECURITIES OF RONI TO BE OFFERED IN ANY TRANSACTION CONTEMPLATED HEREBY HAVE NOT BEEN REGISTERED UNDER THE SECURITIES ACT OF 1933, AS AMENDED (THE “SECURITIES ACT”), OR ANY APPLICABLE STATE OR FOREIGN SECURITIES LAWS. ANY SECURITIES TO BE OFFERED IN ANY TRANSACTION CONTEMPLATED HEREBY HAVE NOT BEEN APPROVED OR DISAPPROVED BY THE SECURITIES AND EXCHANGE COMMISSION (THE “SEC”), ANY STATE SECURITIES COMMISSION OR OTHER UNITED STATES OR FOREIGN REGULATORY AUTHORITY, AND WILL BE OFFERED AND SOLD SOLELY IN RELIANCE ON THE EXEMPTION FROM THE REGISTRATION REQUIREMENTS PROVIDED BY THE SECURITIES ACT AND RULES AND REGULATIONS PROMULGATED THEREUNDER (INCLUDING REGULATION D) OR REGULATION S UNDER THE SECURITIES ACT. THIS DOCUMENT DOES NOT CONSTITUTE AN OFFER TO SELL OR THE SOLICITATION OF AN OFFER TO BUY IN ANY STATE OR OTHER JURISDICTION TO ANY PERSON TO WHOM IT IS UNLAWFUL TO MAKE SUCH OFFER OR SOLICITATION IN SUCH STATE OR JURISDICTION. Any investment in or purchase of any securities of RONI is speculative and involves a high degree of risk and uncertainty. Certain statements in this presentation may constitute “forward - looking statements” within the meaning of Section 27A of the Securities Act of 1933, Section 21E of the Securities Exchange Act of 1934 and the Private Securities Litigation Reform Act of 1995, each as amended. Forward - looking statements provide current expectations of future events and include any statement that does not directly relate to any historical or current fact. Words such as “anticipates,” “believes,” “expects,” “intends,” “plans,” “projects,” or other similar expressions may identify such forward - looking statements. Actual results may differ materially from those discussed in forward - looking statements as a result of factors, risks and uncertainties over which RONI and NET Power have no control. These factors, risks and uncertainties include, but are not limited to, the following: (i) conditions to the completion of the proposed business combination and PIPE investment, including stockholder approval of the business combination, may not be satisfied or the regulatory approvals required for the proposed business combination may not be obtained on the terms expected or on the anticipated schedule; (ii) the occurrence of any event, change or other circumstance that could give rise to the termination of the merger agreement between the parties or the termination of any PIPE investor’s subscription agreement; (iii) the effect of the announcement or pendency of the proposed business combination on NET Power’s business relationships, operating results, and business generally; (iv) risks that the proposed business combination disrupts NET Power’s current plans and operations and potential difficulties in NET Power’s employee retention as a result of the proposed business combination; (v) risks related to diverting management’s attention from NET Power’s ongoing business operations; (vi) potential litigation that may be instituted against RONI or NET Power or their respective directors or officers related to the proposed acquisition or the merger agreement or in relation to NET Power’s business; (vii) the amount of the costs, fees, expenses and other charges related to the proposed business combination and PIPE investment; (viii) risks relating to the uncertainty of the projected financial information with respect to NET Power; (ix) NET Power’s history of significant losses; (x) NET Power’s ability to manage future growth effectively; (xi) NET Power’s ability to utilize its net operating loss and tax credit carryforwards effectively; (xii) NET Power’s ability to continue as a going concern if the transactions contemplated herein are not completed; (xiii) the capital - intensive nature of NET Power’s business model, which may require NET Power to raise additional capital in the future; (xiv) barriers NET Power may face in its attempts to deploy and commercialize its technology; (xv) the complexity of the machinery NET Power relies on for its operations and development; (xvi) NET Power’s ability to establish and maintain supply relationships; (xvii) risks related to NET Power’s joint development arrangements with Baker Hughes and reliance on Baker Hughes to commercialize and deploy its technology; (xviii) risks related to NET Power’s other strategic investors and partners; (xix) NET Power’s ability to successfully commercialize its operations; (xx) the availability and cost of raw materials; (xxi) the ability of NET Power’s supply base to scale to meet NET Power’s anticipated growth; (xxii) risks related to NET Power’s ability to meet its projections; (xxiii) NET Power’s ability to expand internationally; (xxiv) NET Power’s ability to update the design, construction and operations of its NET Power Process (as defined herein); (xxv) the impact of potential delays in discovering manufacturing and construction issues; (xxvi) the possibility of damage to NET Power’s Texas facilities as a result of natural disasters; (xxvii) the ability of commercial plants using the NET Power Process to efficiently provide net power output; (xxviii) NET Power’s ability to obtain and retain licenses; (xxix) NET Power’s ability to establish an initial commercial scale plant; (xxx) NET Power’s ability to license to large customers; (xxxi) NET Power’s ability to accurately estimate future commercial demand; (xxxii) NET Power’s ability to adapt to the rapidly evolving and competitive natural and renewable power industry; (xxxiii) NET Power’s ability to comply with all applicable laws and regulations; (xxxiv) the impact of public perception of fossil fuel derived energy on NET Power’s business; (xxxv) any political or other disruptions in gas producing nations; (xxxvi) NET Power’s ability to protect its intellectual property and the intellectual property it licenses; (xxxvii) the ability to meet stock exchange listing standards following the consummation of the proposed business combination; (xxxviii) changes to the proposed structure of the proposed business combination that may be required or appropriate as a result of applicable laws or regulations, including recent proposals by the SEC or as a condition to obtaining regulatory approval of the proposed business combination; (xxxix) the impact of the global COVID - 19 pandemic on any of the foregoing risks; and (xl) such other factors as are set forth in RONI’s periodic public filings with the SEC, including but not limited to those described under the headings “Risk Factors” and “Cautionary Note Regarding Forward - Looking Statements” in its Annual Report on Form 10 - K for the fiscal year ended December 31, 2021, its subsequent quarterly reports on Form 10 - Q, and in its other filings made with the SEC from time to time, which are available via the SEC’s website at www.sec.gov. None of the Placement Agents (as defined below), RONI or NET Power undertake any duty to update these forward - looking statements or the other information contained in this presentation. This presentation contains projected financial information with respect to the combined company, namely NET Power’s projected EBITDA and enterprise value for future years. Such projected financial information constitutes forward - looking information and is for illustrative purposes only, and should not be relied upon as necessarily being indicative of future results. The assumptions and estimates underlying such projected financial information are inherently uncertain and are subject to a wide variety of significant business, economic, competitive and other risks and uncertainties that could cause actual results to differ materially from those contained in the prospective financial information. Actual results may differ materially from the results contemplated by the projected financial information contained in this presentation, and the inclusion of such information in this presentation should not be regarded as a representation by any person that the results reflected in such projections will be achieved. 2
Disclaimer (2/2) The independent auditors of NET Power have not audited, reviewed, compiled, or performed any procedures with respect to the projections for the purpose of their inclusion in this presentation, and accordingly, did not express an opinion or provide any other form of assurance with respect thereto for the purpose of this presentation. Some of the financial information and data contained in this presentation, such as EBITDA, have not been prepared in accordance with United States generally accepted accounting principles (“GAAP”). EBITDA is defined as net earnings (loss) before interest expense, income tax expense (benefit), depreciation and amortization. NET Power believes these non - GAAP measures of financial results provide useful information to management and investors regarding certain financial and business trends relating to NET Power’s financial condition and results of operations. NET Power believes that the use of these non - GAAP financial measures provides an additional tool for investors to use in evaluating projected operating results and trends. NET Power's method of determining these non - GAAP measures may be different from other companies' methods and, therefore, may not be comparable to those used by other companies and NET Power does not recommend the sole use of these non - GAAP measures to assess its financial performance. Management does not consider these non - GAAP measures in isolation or as an alternative to financial measures determined in accordance with GAAP. The principal limitation of these non - GAAP financial measures is that they exclude significant expenses and income that are required by GAAP to be recorded in NET Power’s financial statements. In addition, they are subject to inherent limitations as they reflect the exercise of judgments by management about which expense and income are excluded or included in determining these non - GAAP financial measures. In order to compensate for these limitations, management presents non - GAAP financial measures in connection with GAAP results. NET Power is not providing a reconciliation of projected EBITDA for future years to the most directly comparable measure prepared in accordance with GAAP because NET Power is unable to provide this reconciliation without unreasonable effort due to the uncertainty and inherent difficulty of predicting the occurrence, the financial impact, and the periods in which the adjustments may be recognized. For the same reasons, NET Power is unable to address the probable significance of the unavailable information, which could be material to future results. Neither RONI nor NET Power makes any representation or warranty, express or implied, as to the accuracy or completeness of this document or any other information (whether written or oral) that has been or will be provided to you. Nothing contained herein or in any other oral or written information provided to you is, nor shall be relied upon as, a promise or representation of any kind by RONI or NET Power. Without limitation of the foregoing, RONI and NET Power expressly disclaim any representation regarding any projections concerning future operating results or any other forward - looking statement contained herein or that otherwise has been or will be provided to you. Neither RONI nor NET Power shall be liable to you or any prospective investor or any other person for any information contained herein or that otherwise has been or will be provided to you, or any action heretofore or hereafter taken or omitted to be taken, in connection with this potential transaction. You will be entitled to rely solely on the representations and warranties made to you by RONI in a definitive written agreement relating to a transaction involving RONI, when and if executed, and subject to any limitations and restrictions as may be specified in such definitive agreement. No other representations and warranties will have any legal effect. RONI has retained Barclays Capital Inc., Citigroup Global Markets Inc. and Credit Suisse Securities (USA) LLC as placement agents (together with their respective affiliates, partners, directors, agents, employees, representatives, and controlling persons, the “Placement Agents”) on a potential transaction to which this document relates. The Placement Agents are acting solely as placement agents (and, for the avoidance of doubt, not as underwriters, initial purchasers, dealers or any other principal capacity) for RONI in connection with a potential transaction. The analyses contained herein have been prepared or adopted by the Company, obtained from public sources, or are based upon estimates and projections, and involve numerous and significant subjective determinations, and there is no assurance that such estimates and projections will be realized. The Placement Agents have not independently verified any of the information or analyses contained herein or any other information that has been or will be provided to you, and do not take responsibility for the analyses contained herein, or the basis on which they were prepared. The Placement Agents do not make any representation or warranty, express or implied, as to the accuracy or completeness of this document or any other information (whether written or oral) that has been or will be provided to you. Nothing contained herein or in any other oral or written information provided to you is, nor shall be relied upon as, a promise or representation of any kind by the Placement Agents, whether as to the past, the present or the future. Without limitation of the foregoing, the Placement Agents expressly disclaim any representation regarding any projections concerning future operating results or any other forward - looking statement contained herein or that otherwise has been or will be provided to you. The Placement Agents shall not be liable to you or any prospective investor or any other person for any information contained herein or that otherwise has been or will be provided to you, or any action heretofore or hereafter taken or omitted to be taken, in connection with this potential transaction. This document is being distributed solely for the consideration of sophisticated prospective purchasers who are institutional accredited investors with sufficient knowledge and experience in investment, financial and business matters and the capability to conduct their own due diligence investigation and evaluation in connection with a potential transaction . This document does not purport to summarize all of the conditions, risks and other attributes of an investment in RONI and NET Power . Information contained herein will be superseded by, and is qualified in its entirety by reference to, any other information that is made available to you in connection with your investigation of RONI and NET Power . Each prospective purchaser is invited to meet with a representative of RONI and/or NET Power and to discuss with, ask questions of, and receive answers from, such representative concerning NET Power and the terms and conditions of any potential transaction . RONI, NET Power and the Placement Agents are free to conduct the process for any transaction as they in their sole discretion determine (including, without limitation, negotiating with any prospective investors and entering into an agreement with respect to any transaction without prior notice to you or any other person), and any procedures relating to such transaction may be changed at any time without notice to you or any other person. No sales will be made, no commitments to invest in RONI will be accepted, and no money is being solicited or will be accepted at this time. Any indication of interest from prospective purchasers in response to this document involves no obligation or commitment of any kind. This document should not be distributed to any person other than the addressee to whom it was initially distributed. 3

Introduction
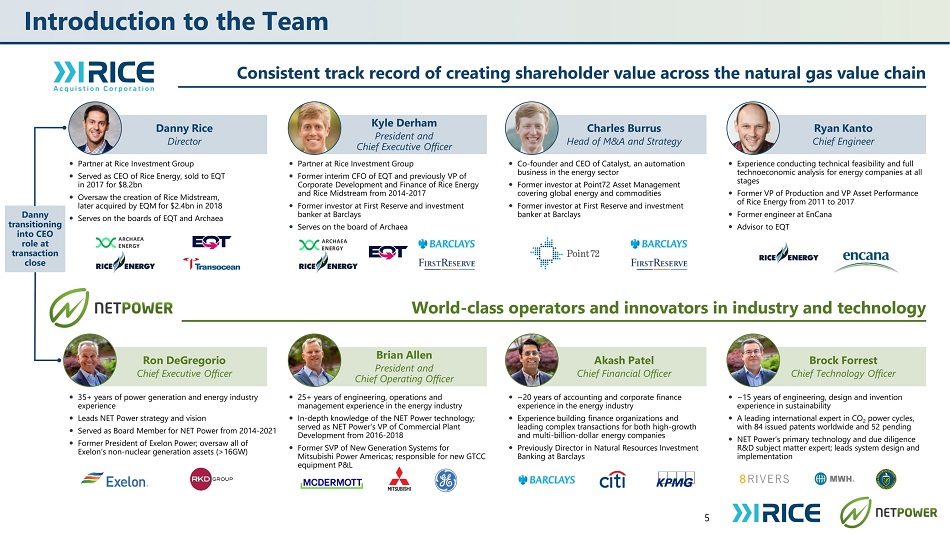
Introduction to the Team ⚫ Partner at Rice Investment Group ⚫ Served as CEO of Rice Energy, sold to EQT in 2017 for $8.2bn ⚫ Oversaw the creation of Rice Midstream, later acquired by EQM for $2.4bn in 2018 ⚫ Serves on the boards of EQT and Archaea ⚫ Partner at Rice Investment Group ⚫ Former interim CFO of EQT and previously VP of Corporate Development and Finance of Rice Energy and Rice Midstream from 2014 - 2017 ⚫ Former investor at First Reserve and investment banker at Barclays ⚫ Serves on the board of Archaea D a nny Ri c e Director Kyle Derham President and Chief Executive Officer ⚫ Co - founder and CEO of Catalyst, an automation business in the energy sector ⚫ Former investor at Point72 Asset Management covering global energy and commodities ⚫ Former investor at First Reserve and investment banker at Barclays ⚫ Experience conducting technical feasibility and full technoeconomic analysis for energy companies at all stages ⚫ Former VP of Production and VP Asset Performance of Rice Energy from 2011 to 2017 ⚫ Former engineer at EnCana ⚫ Advisor to EQT Ryan Kan to C hie f E ng i n e e r Charles Burrus Head of M&A and Strategy Consistent track record of creating shareholder value across the natural gas value chain World - class operators and innovators in industry and technology Ron DeGregorio Chief Executive Officer Brian Allen President and Chief Operating Officer Brock Forrest Chief Technology Officer Akash Patel Chief Financial Officer ⚫ 35+ years of power generation and energy industry experience ⚫ Leads NET Power strategy and vision ⚫ Served as Board Member for NET Power from 2014 - 2021 ⚫ Former President of Exelon Power; oversaw all of Exelon’s non - nuclear generation assets (>16GW) ⚫ 25+ years of engineering, operations and management experience in the energy industry ⚫ In - depth knowledge of the NET Power technology; served as NET Power’s VP of Commercial Plant Development from 2016 - 2018 ⚫ Former SVP of New Generation Systems for Mitsubishi Power Americas; responsible for new GTCC equipment P&L ⚫ ~20 years of accounting and corporate finance experience in the energy industry ⚫ Experience building finance organizations and leading complex transactions for both high - growth and multi - billion - dollar energy companies ⚫ Previously Director in Natural Resources Investment Banking at Barclays ⚫ ~15 years of engineering, design and invention experience in sustainability ⚫ A leading international expert in CO 2 power cycles, with 84 issued patents worldwide and 52 pending ⚫ NET Power’s primary technology and due diligence R&D subject matter expert; leads system design and implementation 5 Danny tran s it i on i n g into CEO role at transaction close
+ Reliable, Low - Cost, Clean Energy from Natural Gas Executive Summary
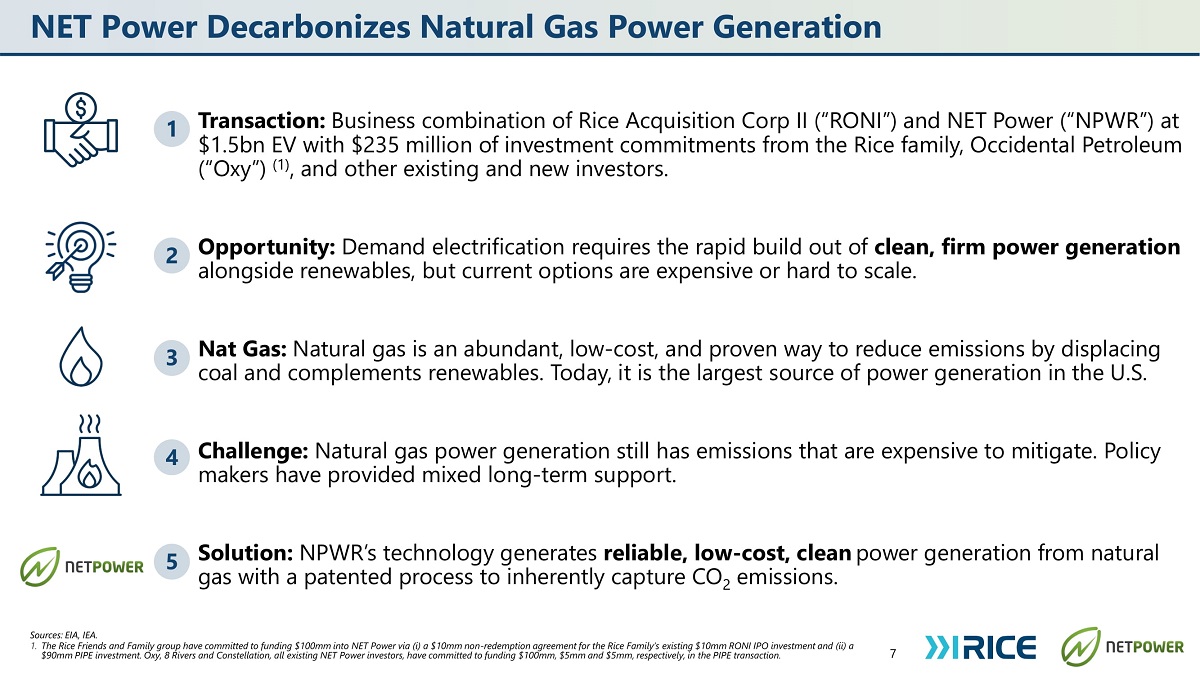
NET Power Decarbonizes Natural Gas Power Generation 7 Transaction: Business combination of Rice Acquisition Corp II (“RONI”) and NET Power (“NPWR”) at $1.5bn EV with $235 million of investment commitments from the Rice family, Occidental Petroleum (“Oxy”) (1) , and other existing and new investors. Opportunity: Demand electrification requires the rapid build out of clean, firm power generation alongside renewables, but current options are expensive or hard to scale. Nat Gas: Natural gas is an abundant, low - cost, and proven way to reduce emissions by displacing coal and complements renewables. Today, it is the largest source of power generation in the U.S. Challenge: Natural gas power generation still has emissions that are expensive to mitigate. Policy makers have provided mixed long - term support. Solution: NPWR’s technology generates reliable, low - cost, clean power generation from natural gas with a patented process to inherently capture CO 2 emissions. 2 1 4 5 3 Sources: EIA, IEA. 1. The Rice Friends and Family group have committed to funding $100mm into NET Power via (i) a $10mm non - redemption agreement for the Rice Family’s existing $10mm RONI IPO investment and (ii) a $90mm PIPE investment. Oxy, 8 Rivers and Constellation, all existing NET Power investors, have committed to funding $100mm, $5mm and $5mm, respectively, in the PIPE transaction.
Use natural gas. Generate reliable electricity. Capture emissions. Change the world.
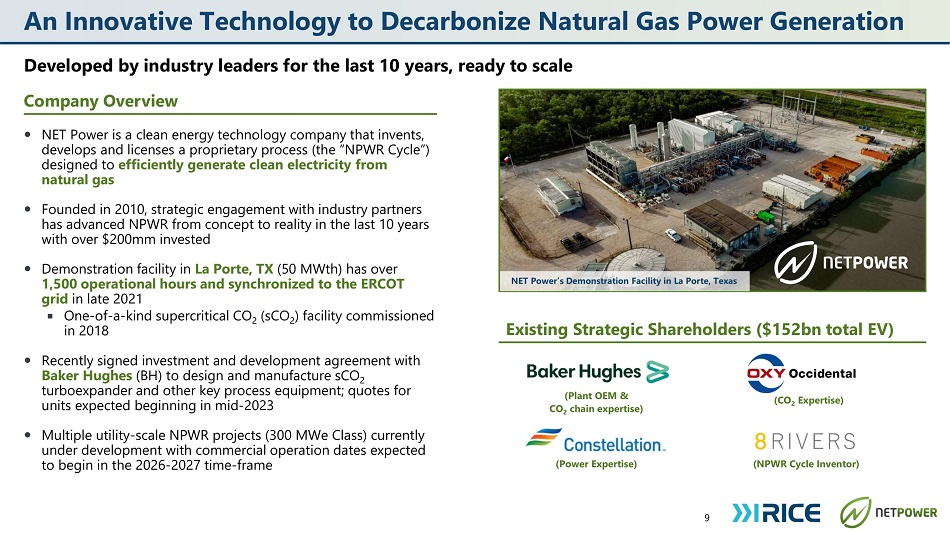
Developed by industry leaders for the last 10 years, ready to scale ⚫ NET Power is a clean energy technology company that invents, develops and licenses a proprietary process (the “NPWR Cycle”) designed to efficiently generate clean electricity from natural gas ⚫ Founded in 2010, strategic engagement with industry partners has advanced NPWR from concept to reality in the last 10 years with over $200mm invested ⚫ Demonstration facility in La Porte, TX (50 MWth) has over 1,500 operational hours and synchronized to the ERCOT grid in late 2021 ◾ One - of - a - kind supercritical CO 2 (sCO 2 ) facility commissioned in 2018 ⚫ Recently signed investment and development agreement with Baker Hughes (BH) to design and manufacture sCO 2 turboexpander and other key process equipment; quotes for units expected beginning in mid - 2023 ⚫ Multiple utility - scale NPWR projects ( 300 MWe Class) currently under development with commercial operation dates expected to begin in the 2026 - 2027 time - frame 9 (NPWR Cycle Inventor) (Power Expertise) 2 (CO Expertise) (Plant OEM & CO 2 chain expertise) Better pic - website NET Power’s Demonstration Facility in La Porte, Texas Company Overview Existing Strategic Shareholders ($152bn total EV) An Innovative Technology to Decarbonize Natural Gas Power Generation
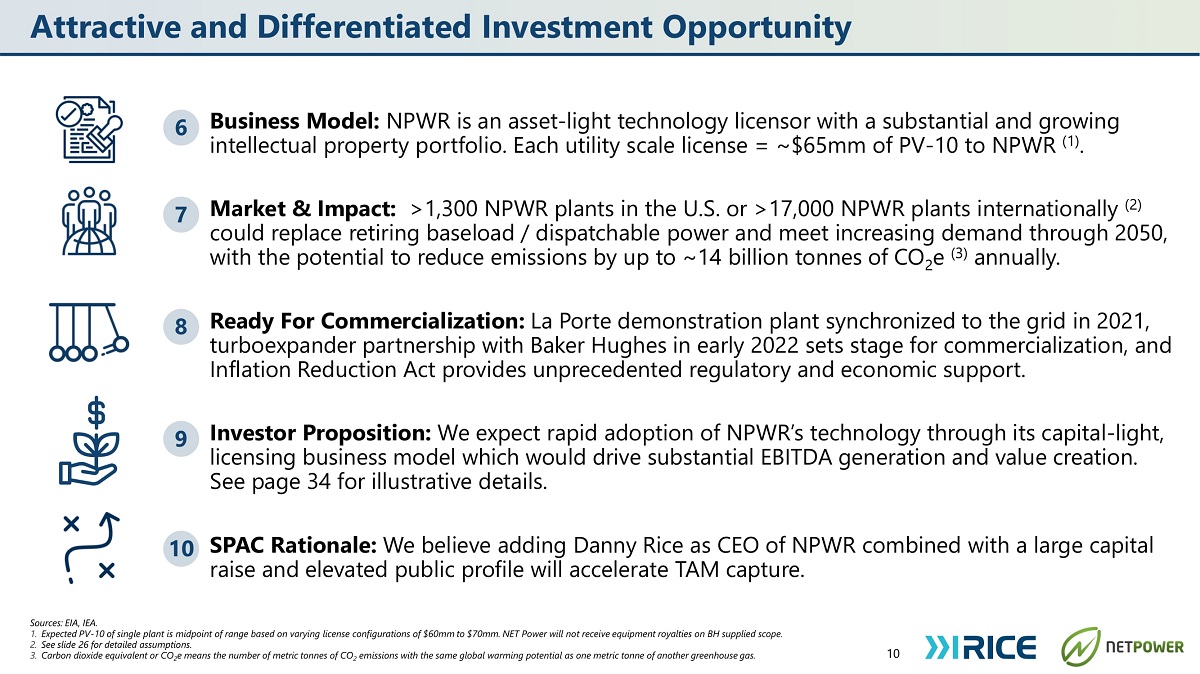
Attractive and Differentiated Investment Opportunity 10 Business Model: NPWR is an asset - light technology licensor with a substantial and growing intellectual property portfolio. Each utility scale license = ~$65mm of PV - 10 to NPWR (1) . Market & Impact: >1,300 NPWR plants in the U.S. or >17,000 NPWR plants internationally (2) could replace retiring baseload / dispatchable power and meet increasing demand through 2050, with the potential to reduce emissions by up to ~14 billion tonnes of CO 2 e (3) annually. Ready For Commercialization: La Porte demonstration plant synchronized to the grid in 2021, turboexpander partnership with Baker Hughes in early 2022 sets stage for commercialization, and Inflation Reduction Act provides unprecedented regulatory and economic support. Investor Proposition: We expect rapid adoption of NPWR’s technology through its capital - light, licensing business model which would drive substantial EBITDA generation and value creation. See page 34 for illustrative details. 6 7 8 9 10 SPAC Rationale: We believe adding Danny Rice as CEO of NPWR combined with a large capital raise and elevated public profile will accelerate TAM capture. Sou rc es: E I A, IE A. 1. Expected PV - 10 of single plant is midpoint of range based on varying license configurations of $60mm to $70mm. NET Power will not receive equipment royalties on BH supplied scope. 2. See slide 26 for detailed assumptions. 3. Carbon dioxide equivalent or CO 2 e means the number of metric tonnes of CO 2 emissions with the same global warming potential as one metric tonne of another greenhouse gas.
+ Reliable, Low - Cost, Clean Energy from Natural Gas Investment Thesis
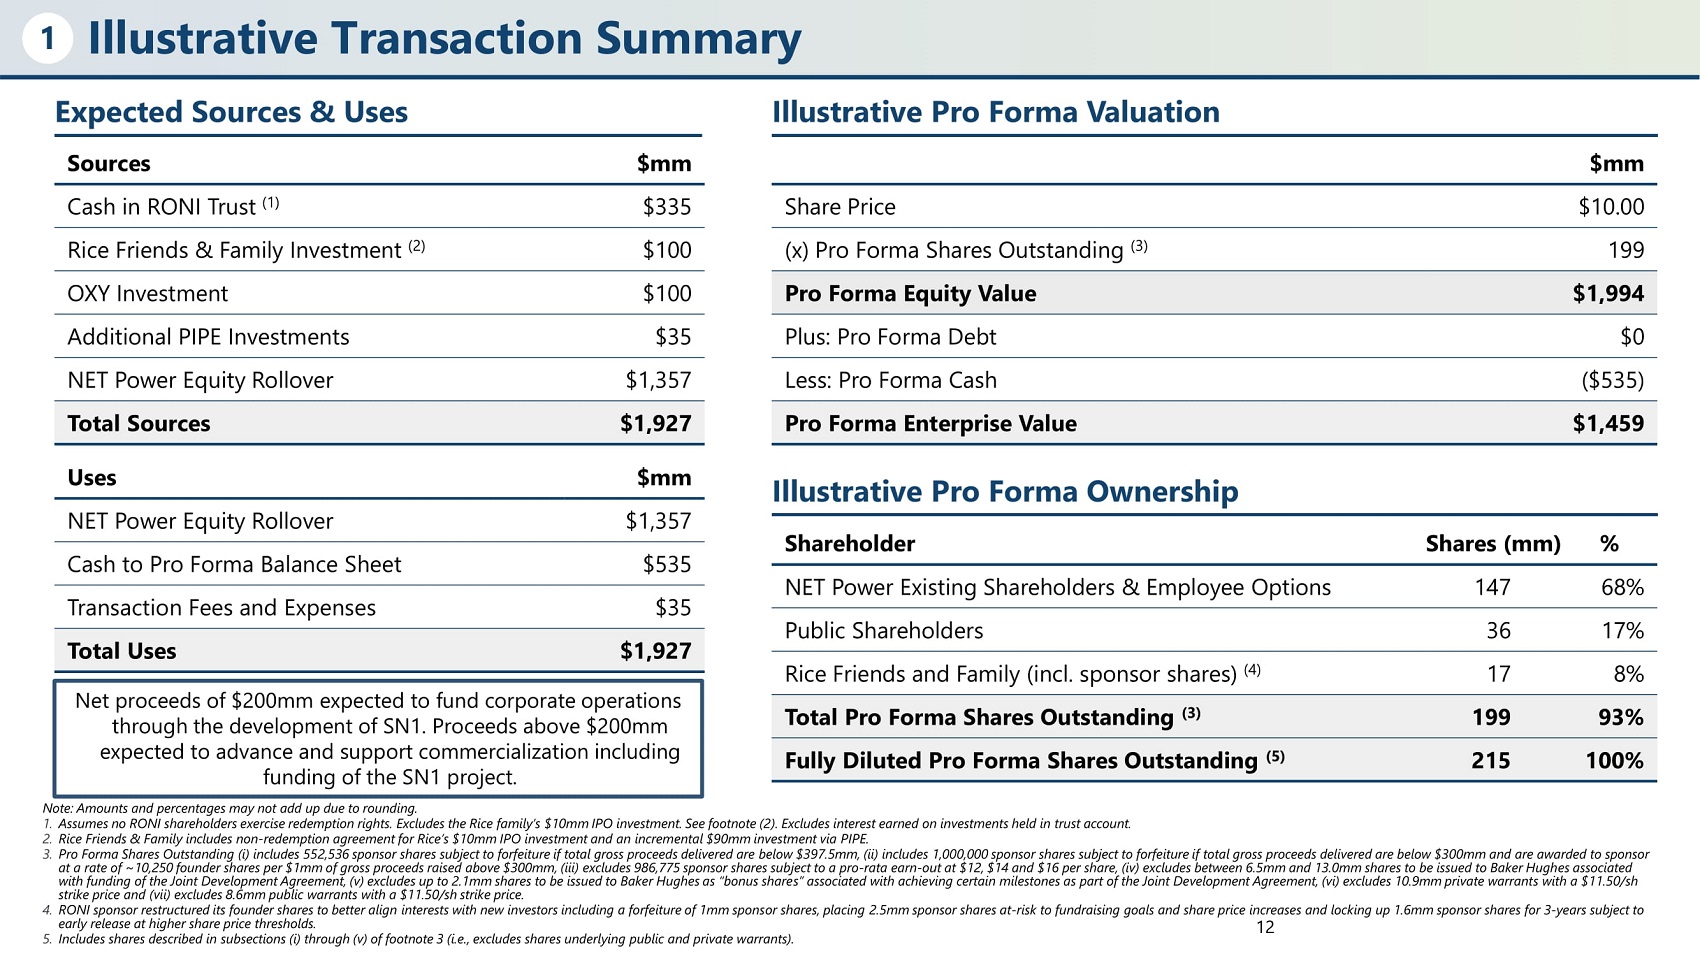
Illustrative Transaction Summary 12 1 Sources $mm Cash in RONI Trust (1) $335 Rice Friends & Family Investment (2) $100 OXY Investment $100 Additional PIPE Investments $35 NET Power Equity Rollover $1,357 Total Sources $1,927 Uses $mm NET Power Equity Rollover $1,357 Cash to Pro Forma Balance Sheet $535 Transaction Fees and Expenses $35 Total Uses $1,927 Shareholder Shares (mm) % NET Power Existing Shareholders & Employee Options 147 68% Public Shareholders 36 17% Rice Friends and Family (incl. sponsor shares) (4) 17 8% Total Pro Forma Shares Outstanding (3) 199 93% Fully Diluted Pro Forma Shares Outstanding (5) 215 100% $mm Share Price $10.00 (x) Pro Forma Shares Outstanding (3) 199 Pro Forma Equity Value $1,994 Plus: Pro Forma Debt $0 Less: Pro Forma Cash ($535) Pro Forma Enterprise Value $1,459 Expected Sources & Uses Illustrative Pro Forma Valuation Illustrative Pro Forma Ownership Note: Amounts and percentages may not add up due to rounding. 1. Assumes no RONI shareholders exercise redemption rights. Excludes the Rice family’s $10mm IPO investment. See footnote (2). 2. Rice Friends & Family includes non - redemption agreement for Rice’s $10mm IPO investment and an incremental $90mm investment via PIPE. 3. Pro Forma Shares Outstanding (i) includes 552,536 sponsor shares subject to forfeiture if total gross proceeds delivered are below $397.5mm, (ii) includes 1,000,000 sponsor shares subject to forfeiture if total gross proceeds delivered are below $300mm and are awarded to sponsor at a rate of ~10,250 founder shares per $1mm of gross proceeds raised above $300mm, (iii) excludes 986,775 sponsor shares subject to a pro - rata earn - out at $12, $14 and $16 per share, (iv) excludes between 6.5mm and 13.0mm shares to be issued to Baker Hughes associated with funding of the Joint Development Agreement, (v) excludes up to 2.1mm shares to be issued to Baker Hughes as “bonus shares” associated with achieving certain milestones as part of the Joint Development Agreement, (vi) excludes 10.9mm private warrants with a $11.50/sh strike price and (vii) excludes 8.6mm public warrants with a $11.50/sh strike price. 4. RONI sponsor restructured its founder shares to better align interests with new investors including a forfeiture of 1mm sponsor shares, placing 2.5mm sponsor shares at - risk to fundraising goals and share price increases and locking up 1.6mm sponsor shares for 3 - years subject to early release at higher share price thresholds. 5. Includes shares described in subsections (i) through (v) of footnote 3 (i.e., excludes shares underlying public and private warrants). Net proceeds of $200mm expected to fund corporate operations through the development of SN1. Proceeds above $200mm expected to advance and support commercialization including funding of the SN1 project.
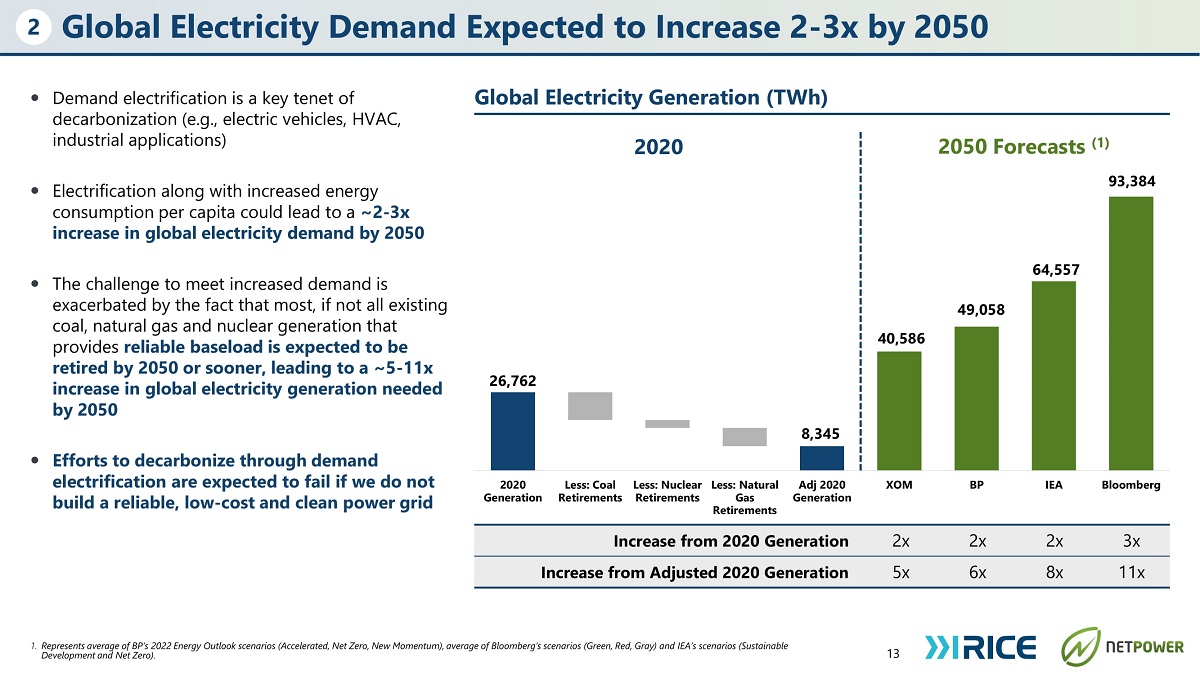
Global Electricity Demand Expected to Increase 2 - 3x by 2050 ⚫ Demand electrification is a key tenet of decarbonization (e.g., electric vehicles, HVAC, industrial applications) ⚫ Electrification along with increased energy consumption per capita could lead to a ~2 - 3x increase in global electricity demand by 2050 ⚫ The challenge to meet increased demand is exacerbated by the fact that most, if not all existing coal, natural gas and nuclear generation that provides reliable baseload is expected to be retired by 2050 or sooner, leading to a ~5 - 11x increase in global electricity generation needed by 2050 ⚫ Efforts to decarbonize through demand electrification are expected to fail if we do not build a reliable, low - cost and clean power grid 1. Represents average of BP’s 2022 Energy Outlook scenarios (Accelerated, Net Zero, New Momentum), average of Bloomberg’s scenarios (Green, Red, Gray) and IEA’s scenarios (Sustainable Deve l opm e n t a n d N et Ze r o ). 13 2 26,762 8,345 40,586 49,058 64,5 5 7 202 0 L ess: Co a l L ess: Nu c l e a r Generation Retirements Retirements Less: Natural Adj 2020 Ga s G e n era tion Retirements XOM BP IEA Bloomberg 2050 Forecasts (1) 93,384 Increase from 2020 Generation 2x 2x 2x 3x Increase from Adjusted 2020 Generation 5x 6x 8x 11x 2020 Global Electricity Generation (TWh)
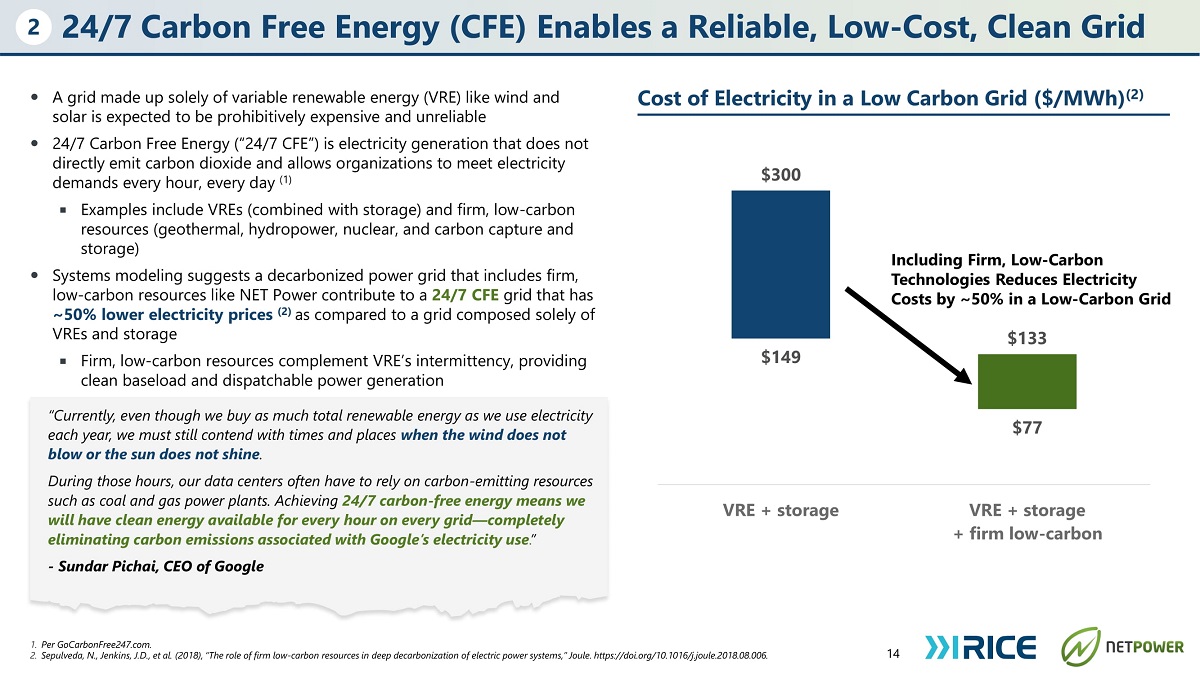
$149 $77 $300 Including Firm, Low - Carbon Technologies Reduces Electricity Costs by ~50% in a Low - Carbon Grid $133 VRE + storage VRE + storage + firm low - carbon 24/7 Carbon Free Energy (CFE) Enables a Reliable, Low - Cost, Clean Grid 1. Per GoCarbonFree247.com. 2. Sepulveda, N., Jenkins, J.D., et al. (2018), “The role of firm low - carbon resources in deep decarbonization of electric power systems,” Joule. https://doi.org/10.1016/j.joule.2018.08.006. 14 2 ⚫ A grid made up solely of variable renewable energy (VRE) like wind and solar is expected to be prohibitively expensive and unreliable ⚫ 24/7 Carbon Free Energy (“24/7 CFE”) is electricity generation that does not directly emit carbon dioxide and allows organizations to meet electricity demands every hour, every day (1) ◾ Examples include VREs (combined with storage) and firm, low - carbon resources (geothermal, hydropower, nuclear, and carbon capture and storage) ⚫ Systems modeling suggests a decarbonized power grid that includes firm, low - carbon resources like NET Power contribute to a 24 / 7 CFE grid that has ~50% lower electricity prices (2) as compared to a grid composed solely of VREs and storage ◾ Firm, low - carbon resources complement VRE’s intermittency, providing clean baseload and dispatchable power generation “Currently, even though we buy as much total renewable energy as we use electricity each year, we must still contend with times and places when the wind does not blow or the sun does not shine . During those hours, our data centers often have to rely on carbon - emitting resources such as coal and gas power plants. Achieving 24/7 carbon - free energy means we will have clean energy available for every hour on every grid — completely eliminating carbon emissions associated with Google’s electricity use . ” - Sundar Pichai, CEO of Google Cost of Electricity in a Low Carbon Grid ($/MWh) (2)
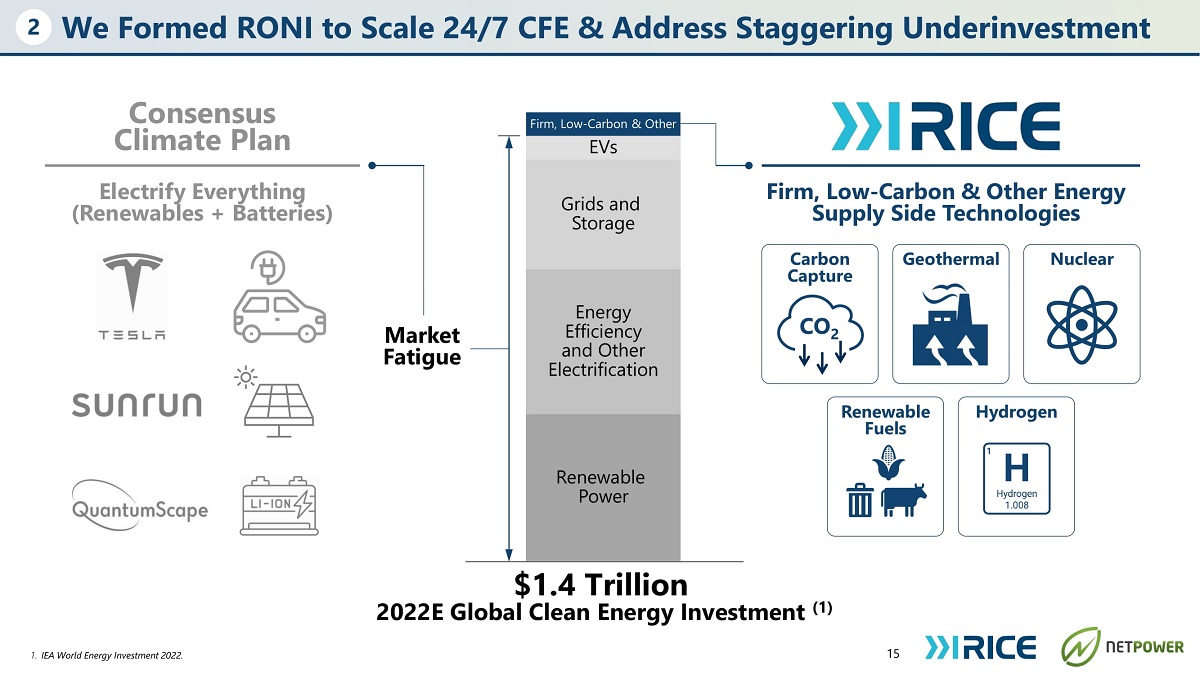
Firm, Low - Carbon & Oth er EVs Grids and Storage Energy Efficiency and Other E l ec tr ific at i on R en e wa b le Power We Formed RONI to Scale 24/7 CFE & Address Staggering Underinvestment 1. IEA World Energy Investment 2022. 2 $1.4 Trillion 2022E Global Clean Energy Investment (1) Firm, Low - Carbon & Other Energy Supply Side Technologies Carbon Ge o t herm al N ucl e ar Capture R en ewable Fuels Hydrogen Electrify Everything (Renewables + Batteries) Consensus Climate Plan Market Fatigue 15 CO 2
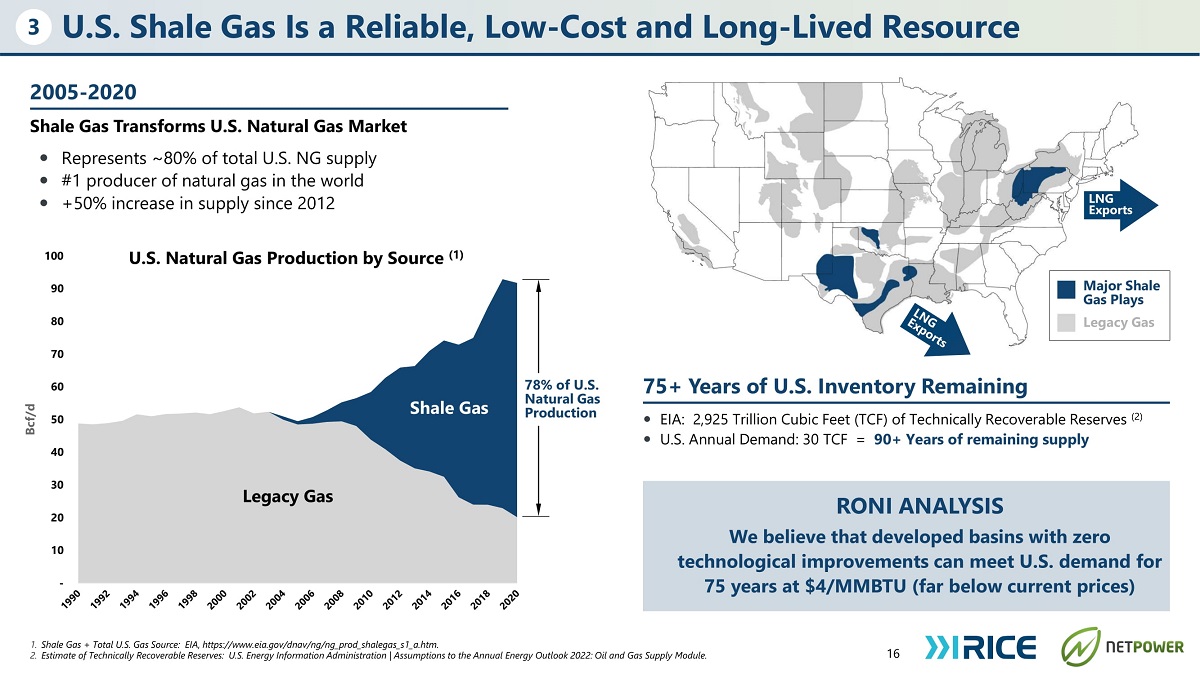
U.S. Shale Gas Is a Reliable, Low - Cost and Long - Lived Resource 16 1. Shale Gas + Total U.S. Gas Source: EIA, https: //w ww .eia.gov/dnav/ng/ng_prod_shalegas_s1_a.htm. 2. Estimate of Technically Recoverable Reserves: U.S. Energy Information Administration | Assumptions to the Annual Energy Outlook 2022: Oil and Gas Supply Module. 3 Shale Gas Transforms U.S. Natural Gas Market ⚫ Represents ~80% of total U.S. NG supply ⚫ #1 producer of natural gas in the world ⚫ +50% increase in supply since 2012 - 10 20 3 0 40 50 60 70 80 90 10 0 Bcf/ d U.S. Natural Gas Production by Source (1) Shale Gas Legacy Gas 78% of U.S. Na t u r a l G as Production L NG Exports Ma jo r S h a le Gas Plays Leg a cy G as ⚫ EIA: 2,925 Trillion Cubic Feet (TCF) of Technically Recoverable Reserves (2) ⚫ U.S. Annual Demand: 30 TCF = 90+ Years of remaining supply RONI ANALYSIS We believe that developed basins with zero technological improvements can meet U.S. demand for 75 years at $4/MMBTU (far below current prices) 2005 - 2020 75+ Years of U.S. Inventory Remaining
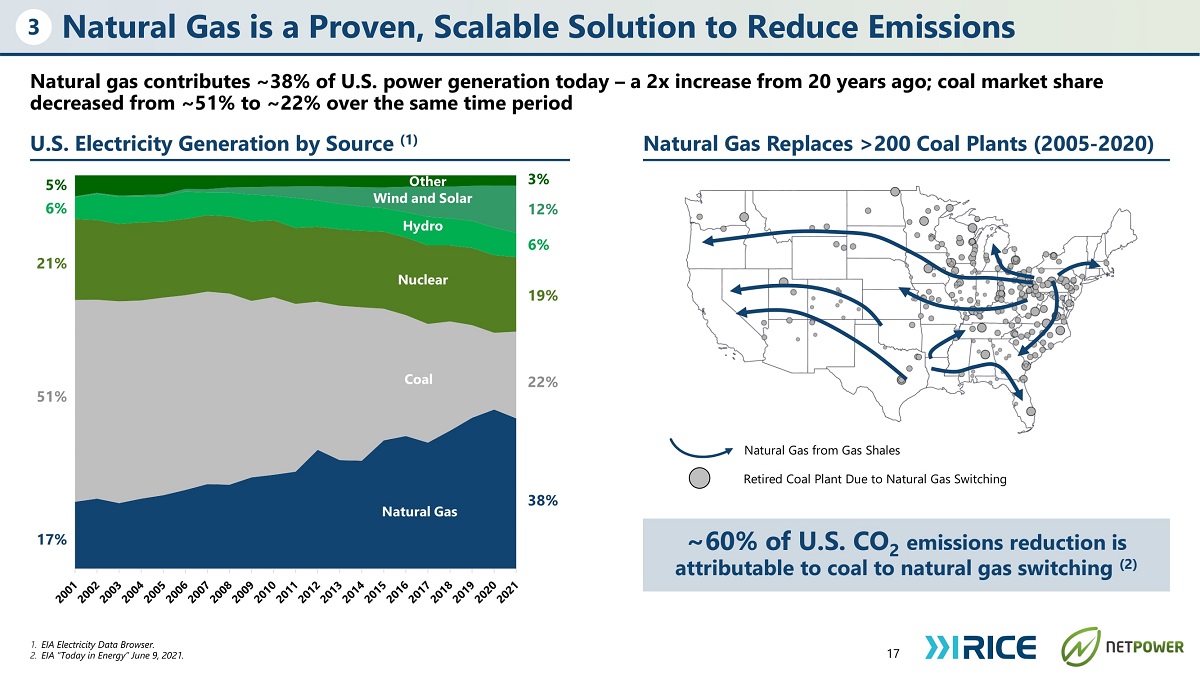
Natural Gas is a Proven, Scalable Solution to Reduce Emissions Natural gas contributes ~38% of U.S. power generation today – a 2x increase from 20 years ago; coal market share decreased from ~51% to ~22% over the same time period U.S. Electricity Generation by Source (1) Natural Gas Replaces >200 Coal Plants (2005 - 2020) 17 1. EIA Electricity Data Browser. 2. EIA “Today in Energy” June 9, 2021. 3 ~60% of U.S. CO 2 emissions reduction is attributable to coal to natural gas switching (2) Natural Gas from Gas Shales Retired Coal Plant Due to Natural Gas Switching 17% 51% 21% 5% 6% Co al Na t u r a l G as Hydro Wind and Solar Nuclear 19% 38% 22% 3% 12% 6% O t h er
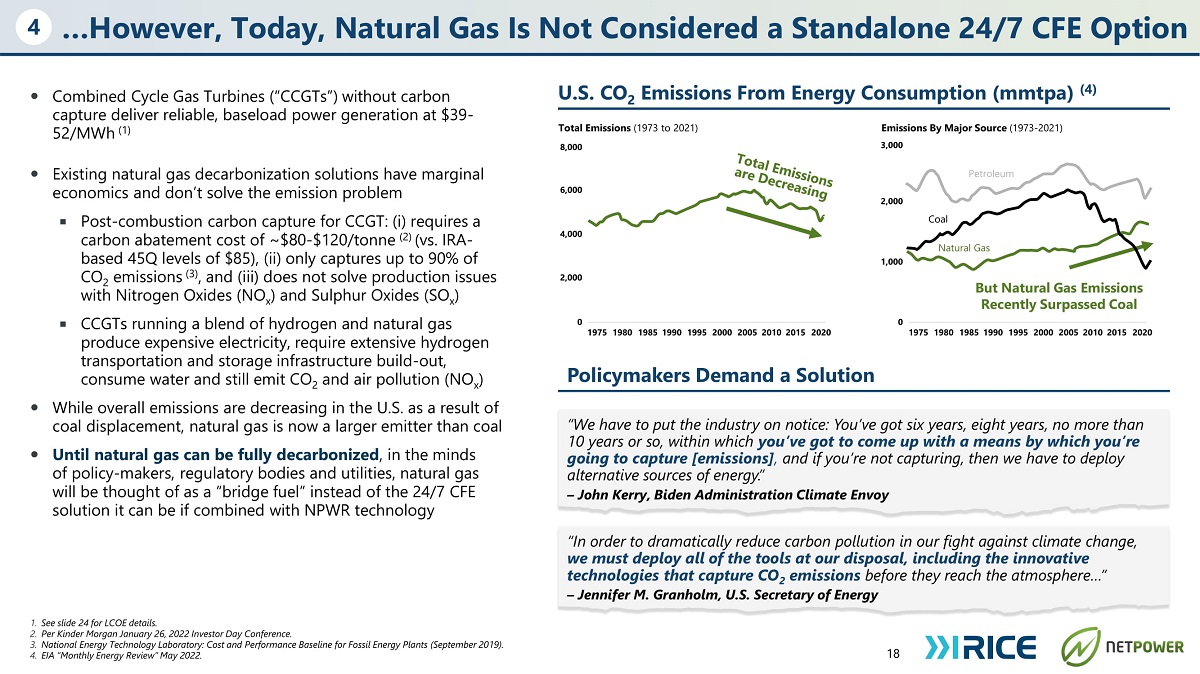
…However, Today, Natural Gas Is Not Considered a Standalone 24/7 CFE Option ⚫ Combined Cycle Gas Turbines (“CCGTs”) without carbon capture deliver reliable, baseload power generation at $39 - 52/MWh (1) ⚫ Existing natural gas decarbonization solutions have marginal economics and don’t solve the emission problem ◾ Post - combustion carbon capture for CCGT: (i) requires a carbon abatement cost of ~$80 - $120/tonne (2) (vs. IRA - based 45Q levels of $85), (ii) only captures up to 90% of CO 2 emissions (3) , and (iii) does not solve production issues with Nitrogen Oxides (NO x ) and Sulphur Oxides (SO x ) ◾ CCGTs running a blend of hydrogen and natural gas produce expensive electricity, require extensive hydrogen transportation and storage infrastructure build - out, consume water and still emit CO 2 and air pollution (NO x ) ⚫ While overall emissions are decreasing in the U.S. as a result of coal displacement, natural gas is now a larger emitter than coal ⚫ Until natural gas can be fully decarbonized , in the minds of policy - makers, regulatory bodies and utilities, natural gas will be thought of as a “bridge fuel” instead of the 24 / 7 CFE solution it can be if combined with NPWR technology 1. See slide 24 for LCOE details. 2. Per Kinder Morgan January 26, 2022 Investor Day Conference. 3. National Energy Technology Laboratory: Cost and Performance Baseline for Fossil Energy Plants (September 2019). 4. E IA “Mo nthl y E n e r gy Rev i e w ” May 2022. 4 “We have to put the industry on notice : You’ve got six years, eight years, no more than 10 years or so, within which you’ve got to come up with a means by which you’re going to capture [emissions] , and if you’re not capturing, then we have to deploy alternative sources of energy . ” – John Kerry, Biden Administration Climate Envoy “In order to dramatically reduce carbon pollution in our fight against climate change, we must deploy all of the tools at our disposal, including the innovative technologies that capture CO 2 emissions before they reach the atmosphere…” – Jennifer M. Granholm, U.S. Secretary of Energy U.S. CO 2 Emissions From Energy Consumption (mmtpa) (4) Policymakers Demand a Solution 18 Total Emissions (1973 to 2021) 8,000 Emissions By Major Source (1973 - 2021) 3,000 Petroleum 2,000 Coal Natural Gas 1,000 But Natural Gas Emissions Recently Surpassed Coal 0 1975 1980 1985 1990 1995 2000 2005 2010 2015 2020 6 , 00 0 4 , 00 0 2 , 00 0 0 1975 1980 1985 1990 1995 2000 2005 2010 2015 2020
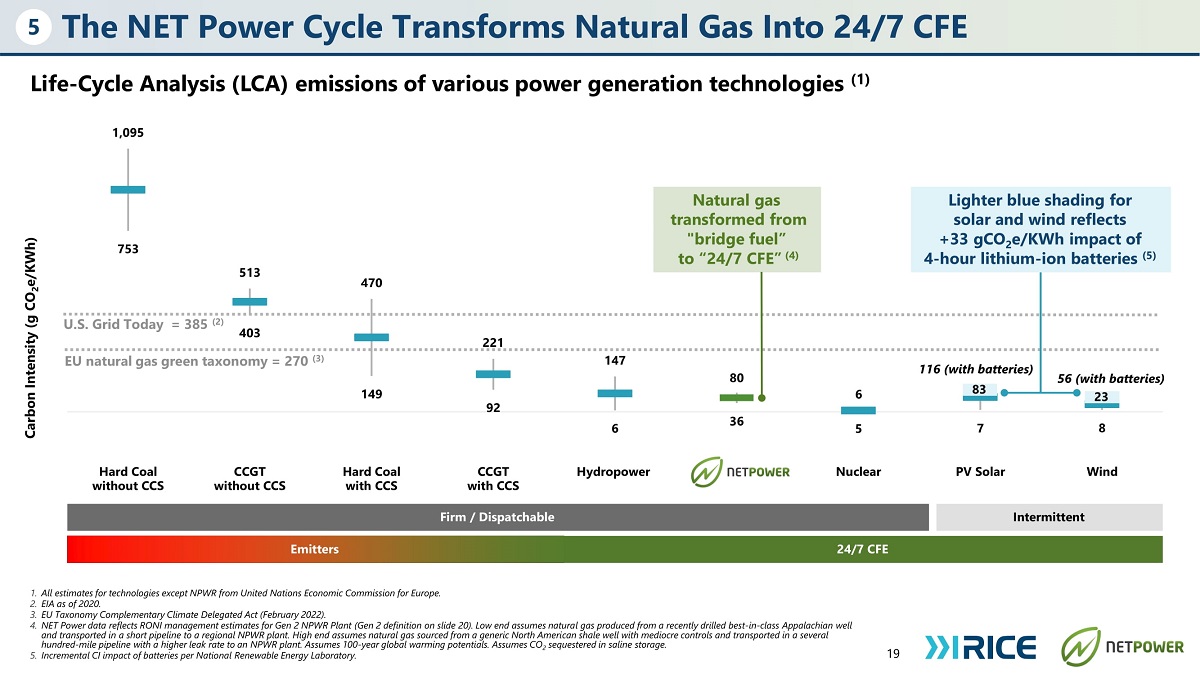
Life - Cycle Analysis (LCA) emissions of various power generation technologies (1) 19 1. All estimates for technologies except NPWR from United Nations Economic Commission for Europe. 2. EIA as of 2020. 3. EU Taxonomy Complementary Climate Delegated Act (February 2022). 4. NET Power data reflects RONI management estimates for Gen 2 NPWR Plant (Gen 2 definition on slide 20). Low end assumes natural gas produced from a recently drilled best - in - class Appalachian well and transported in a short pipeline to a regional NPWR plant. High end assumes natural gas sourced from a generic North American shale well with mediocre controls and transported in a several hundred - mile pipeline with a higher leak rate to an NPWR plant. Assumes 100 - year global warming potentials. Assumes CO 2 sequestered in saline storage. 5. Incremental CI impact of batteries per National Renewable Energy Laboratory. 5 1 , 095 513 470 221 147 80 6 116 (with batteries) 56 (with batteries) 753 403 149 92 6 36 5 7 8 Hard Coal w i th out CCS CCGT without CCS Hard Coal with CCS CCGT with CCS Hydropower N E T P o wer Nuclear PV Solar W ind Carbon Intensity (g CO 2 e/KWh) U.S. Grid Today = 385 (2) Intermittent Firm / Dispatchable Emitters 24/7 CFE 23 83 EU natural gas green taxonomy = 270 (3) Lighter blue shading for solar and wind reflects +33 gCO 2 e/KWh impact of 4 - hour lithium - ion batteries (5) Natural gas transformed from "bridge fuel” t o “24/ 7 CF E ” ( 4 ) The NET Power Cycle Transforms Natural Gas Into 24/7 CFE
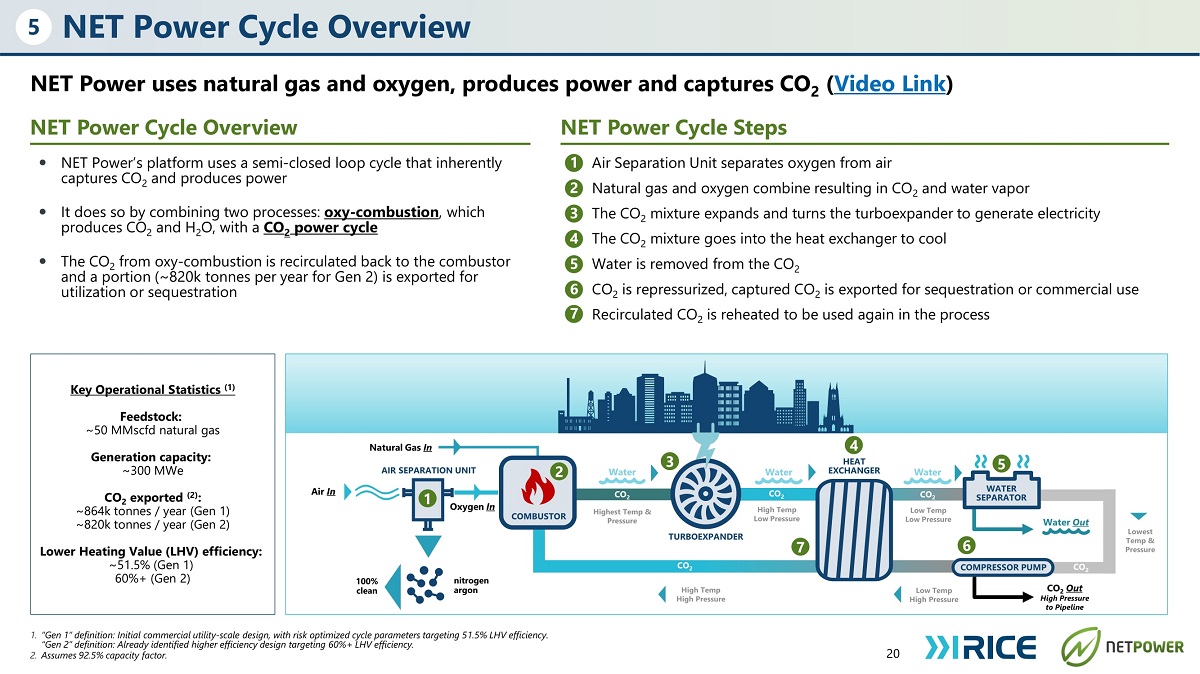
NET Power Cycle Overview NET Power uses natural gas and oxygen, produces power and captures CO 2 ( Video Link ) NET Power Cycle Overview NET Power Cycle Steps 20 ⚫ NET Power’s platform uses a semi - closed loop cycle that inherently captures CO 2 and produces power ⚫ It does so by combining two processes: oxy - combustion , which produces CO 2 and H 2 O, with a CO 2 power cycle ⚫ The CO 2 from oxy - combustion is recirculated back to the combustor and a portion (~820k tonnes per year for Gen 2) is exported for utilization or sequestration The CO mixture goes into the heat exchanger to cool 2 Water is removed from the CO 2 CO 2 is repressurized, captured CO 2 is exported for sequestration or commercial use Recirculated CO 2 is reheated to be used again in the process N a t u r a l G a s In AIR SEPARATION UNIT TUR BO E X PAND ER HEAT EXC H AN GER 100% clean n i tr o ge n argon Wa t er Highest Temp & Pressure C O 2 O u t H igh P ressure to Pipeline Wa t er O u t High Temp Hig h Press u re Ai r In Lowest T emp & Press u re Water CO 2 High Temp Low Press u re CO 2 Water CO 2 Low Temp Low Press u re CO 2 CO M BU S TOR 2 3 4 5 7 6 CO M PRE SS O R P U M P WATER S E P ARATOR CO 2 5 Key Operational Statistics (1) Feedstock: ~50 MMscfd natural gas Generation capacity: ~300 MWe CO 2 exported (2) : ~864k tonnes / year (Gen 1) ~820k tonnes / year (Gen 2) Lower Heating Value (LHV) efficiency: ~51.5% (Gen 1) 60%+ (Gen 2) 1. “Gen 1” definition: Initial commercial utility - scale design, with risk optimized cycle parameters targeting 51.5% LHV efficiency. “Gen 2” definition: Already identified higher efficiency design targeting 60%+ LHV efficiency. 2. Assumes 92.5% capacity factor. Low T emp Hig h Press u re Ox yg e n In ؘ 1 Air Separation Unit separates oxygen from air ؘ 2 Natural gas and oxygen combine resulting in CO 2 and water vapor ؘ 3 The CO 2 mixture expands and turns the turboexpander to generate electricity ؘ 4 ؘ 5 ؘ 6 ؘ 7 1
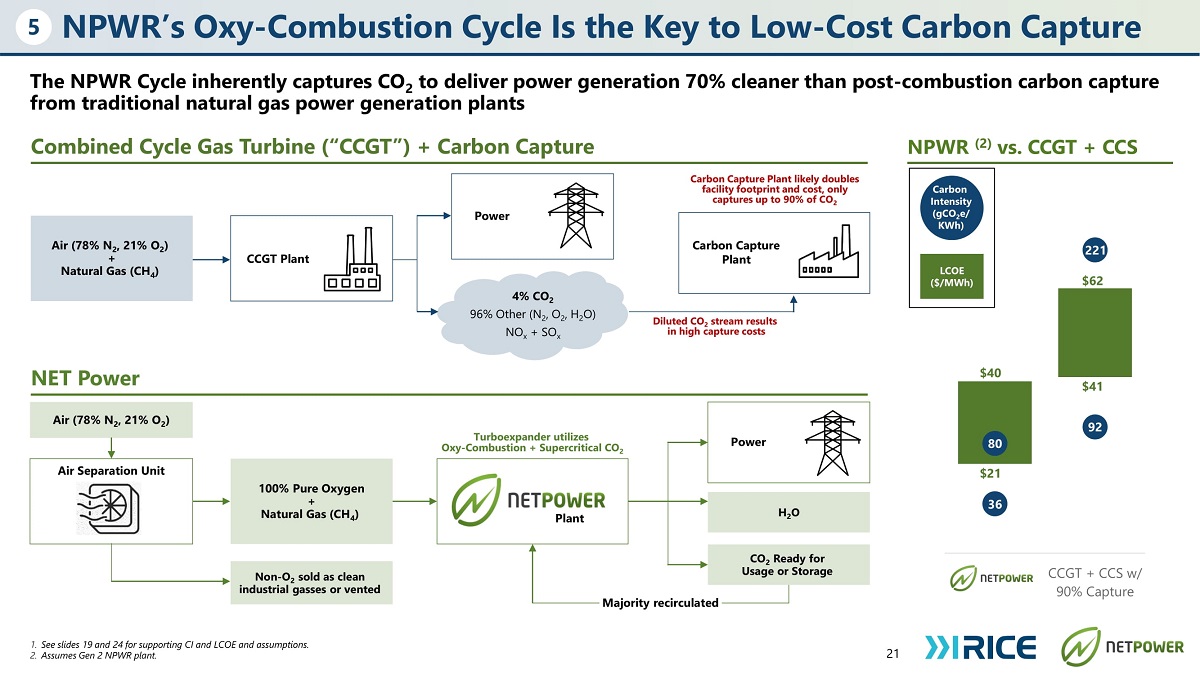
CCGT + CCS w/ 90% Capture NPWR (2) vs. CCGT + CCS 36 $62 $41 $40 $21 221 NPWR’s Oxy - Combustion Cycle Is the Key to Low - Cost Carbon Capture The NPWR Cycle inherently captures CO 2 to deliver power generation 70% cleaner than post - combustion carbon capture from traditional natural gas power generation plants Combined Cycle Gas Turbine (“CCGT”) + Carbon Capture 21 1. See slides 19 and 24 for supporting CI and LCOE and assumptions. 2. Assumes Gen 2 NPWR plant. 5 Air (78% N 2 , 21% O 2 ) + Natural Gas (CH 4 ) CCGT Plant Power Carbon Capture Plant Carbon Capture Plant likely doubles facility footprint and cost, only captures up to 90% of CO 2 Diluted CO 2 stream results in high capture costs Air (78% N 2 , 21% O 2 ) Non - O 2 sold as clean industrial gasses or vented CO 2 Ready for Usage or Storage 100% Pure Oxygen + Natural Gas (CH 4 ) Plant Air Separation Unit H 2 O Turboexpander utilizes Oxy - Combustion + Supercritical CO 2 Power Majority recirculated NET Power LCOE ($/MWh) Carbon I n te n s ity (gCO 2 e/ KWh) 92 80 4% CO 2 96% Other (N 2 , O 2 , H 2 O) NO x + SO x
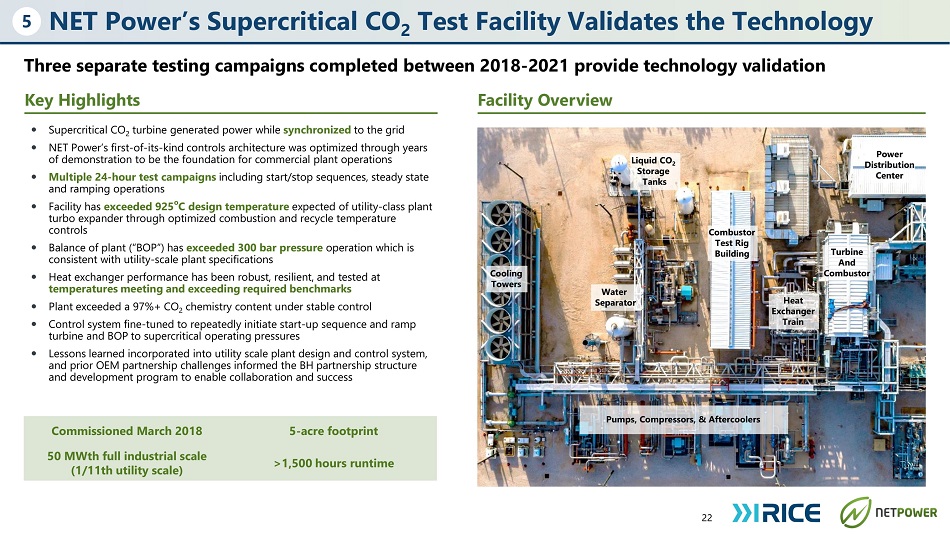
NET Power’s Supercritical CO 2 Test Facility Validates the Technology Three separate testing campaigns completed between 2018 - 2021 provide technology validation Key Highlights Facility Overview ⚫ Supercritical CO 2 turbine generated power while synchronized to the grid ⚫ NET Power’s first - of - its - kind controls architecture was optimized through years of demonstration to be the foundation for commercial plant operations ⚫ Multiple 24 - hour test campaigns including start/stop sequences, steady state and ramping operations ⚫ Facility has exceeded 925 o C design temperature expected of utility - class plant turbo expander through optimized combustion and recycle temperature controls ⚫ Balance of plant (“BOP”) has exceeded 300 bar pressure operation which is consistent with utility - scale plant specifications ⚫ Heat exchanger performance has been robust, resilient, and tested at temperatures meeting and exceeding required benchmarks ⚫ Plant exceeded a 97%+ CO 2 chemistry content under stable control ⚫ Control system fine - tuned to repeatedly initiate start - up sequence and ramp turbine and BOP to supercritical operating pressures ⚫ Lessons learned incorporated into utility scale plant design and control system, and prior OEM partnership challenges informed the BH partnership structure and development program to enable collaboration and success 22 5 Pumps, Compressors, & Aftercoolers Cooling Towers Water Se p a ra tor Liquid CO 2 Storage Tanks Combustor Test Rig Building Heat Ex ch a n g er Train Turbine And Com b u stor Power Di str i b ut i on Center 5 - acre footprint Commissioned March 2018 50 MWth full industrial scale (1/11th utility scale) >1,500 hours runtime
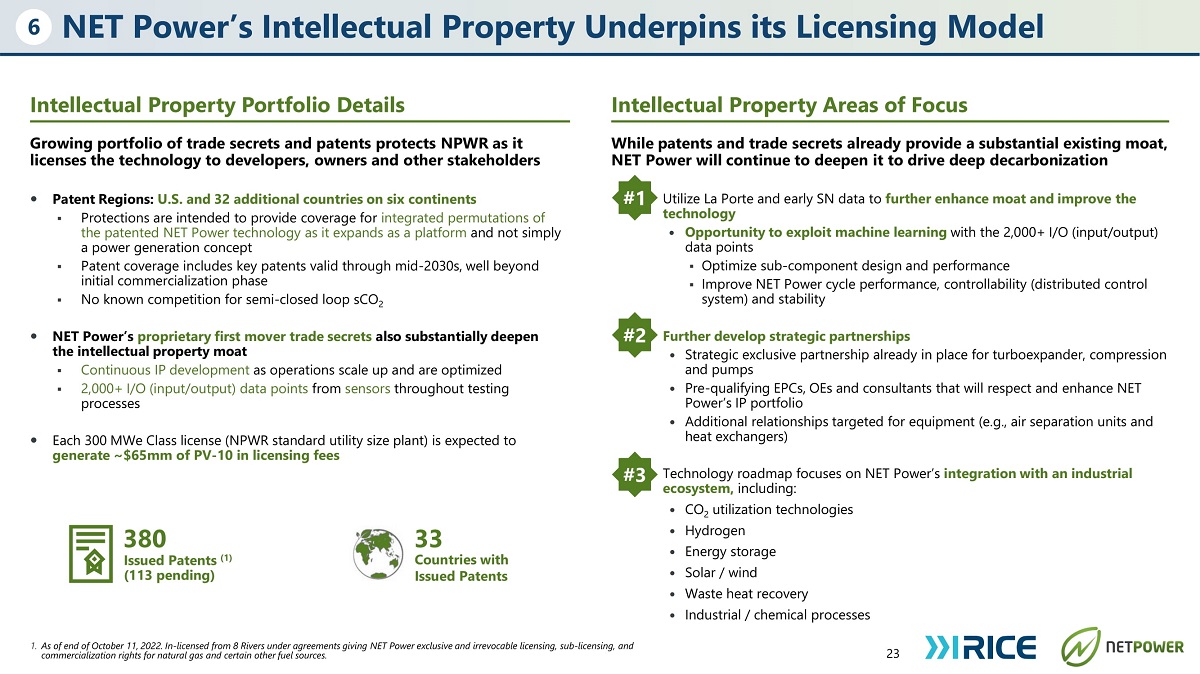
1) Utilize La Porte and early SN data to further enhance moat and improve the technology ⚫ Opportunity to exploit machine learning with the 2,000+ I/O (input/output) data points ▪ Optimize sub - component design and performance ▪ Improve NET Power cycle performance, controllability (distributed control system) and stability 2) Further develop strategic partnerships ⚫ Strategic exclusive partnership already in place for turboexpander, compression and pumps ⚫ Pre - qualifying EPCs, OEs and consultants that will respect and enhance NET Power’s IP portfolio ⚫ Additional relationships targeted for equipment (e.g., air separation units and heat exchangers) 3) Technology roadmap focuses on NET Power’s integration with an industrial ecosystem, including: ⚫ CO 2 utilization technologies ⚫ Hydrogen ⚫ Energy storage ⚫ Solar / wind ⚫ Waste heat recovery ⚫ Industrial / chemical processes While patents and trade secrets already provide a substantial existing moat, NET Power will continue to deepen it to drive deep decarbonization Growing portfolio of trade secrets and patents protects NPWR as it licenses the technology to developers, owners and other stakeholders NET Power’s Intellectual Property Underpins its Licensing Model 23 6 #1 #2 #3 380 Issued Patents (1) (113 pending) Intellectual Property Portfolio Details Intellectual Property Areas of Focus ⚫ Patent Regions: U.S. and 32 additional countries on six continents ▪ Protections are intended to provide coverage for integrated permutations of the patented NET Power technology as it expands as a platform and not simply a power generation concept ▪ Patent coverage includes key patents valid through mid - 2030s, well beyond initial commercialization phase ▪ No known competition for semi - closed loop sCO 2 ⚫ NET Power’s proprietary first mover trade secrets also substantially deepen the intellectual property moat ▪ Continuous IP development as operations scale up and are optimized ▪ 2,000+ I/O (input/output) data points from sensors throughout testing processes ⚫ Each 300 MWe Class license (NPWR standard utility size plant) is expected to generate ~$65mm of PV - 10 in licensing fees 33 Cou n t r ie s with Issued Patents 1. As of end of October 11, 2022. In - licensed from 8 Rivers under agreements giving NET Power exclusive and irrevocable licensing, sub - licensing, and commercialization rights for natural gas and certain other fuel sources.
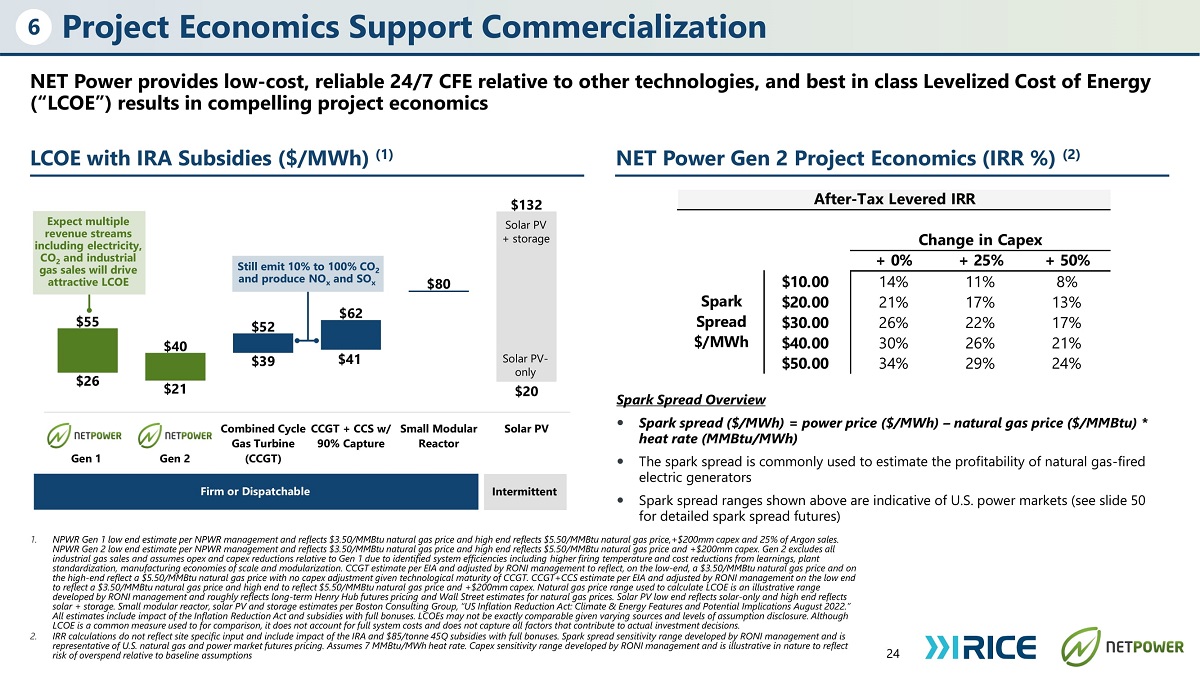
$26 $21 $39 $41 $20 $55 $40 $52 $62 $80 $132 Combined Cycle CCGT + CCS w/ Gas Turbine 90% Capture (CCGT) Small Modular Reactor Solar PV Project Economics Support Commercialization NET Power provides low - cost, reliable 24/7 CFE relative to other technologies, and best in class Levelized Cost of Energy (“LCOE”) results in compelling project economics LCOE with IRA Subsidies ($/MWh) (1) NET Power Gen 2 Project Economics (IRR %) (2) 24 1. NPWR Gen 1 low end estimate per NPWR management and reflects $3.50/MMBtu natural gas price and high end reflects $5.50/MMBtu natural gas price,+$200mm capex and 25% of Argon sales. NPWR Gen 2 low end estimate per NPWR management and reflects $3.50/MMBtu natural gas price and high end reflects $5.50/MMBtu natural gas price and +$200mm capex. Gen 2 excludes all industrial gas sales and assumes opex and capex reductions relative to Gen 1 due to identified system efficiencies including higher firing temperature and cost reductions from learnings, plant standardization, manufacturing economies of scale and modularization. CCGT estimate per EIA and adjusted by RONI management to reflect, on the low - end, a $3.50/MMBtu natural gas price and on the high - end reflect a $5.50/MMBtu natural gas price with no capex adjustment given technological maturity of CCGT. CCGT+CCS estimate per EIA and adjusted by RONI management on the low end to reflect a $3.50/MMBtu natural gas price and high end to reflect $5.50/MMBtu natural gas price and +$200mm capex. Natural gas price range used to calculate LCOE is an illustrative range developed by RONI management and roughly reflects long - term Henry Hub futures pricing and Wall Street estimates for natural gas prices. Solar PV low end reflects solar - only and high end reflects solar + storage. Small modular reactor, solar PV and storage estimates per Boston Consulting Group, “US Inflation Reduction Act: Climate & Energy Features and Potential Implications August 2022.” All estimates include impact of the Inflation Reduction Act and subsidies with full bonuses. LCOEs may not be exactly comparable given varying sources and levels of assumption disclosure. Although LCOE is a common measure used to for comparison, it does not account for full system costs and does not capture all factors that contribute to actual investment decisions. 2. IRR calculations do not reflect site specific input and include impact of the IRA and $ 85 /tonne 45 Q subsidies with full bonuses . Spark spread sensitivity range developed by RONI management and is representative of U . S . natural gas and power market futures pricing . Assumes 7 MMBtu/MWh heat rate . Capex sensitivity range developed by RONI management and is illustrative in nature to reflect risk of overspend relative to baseline assumptions 6 Expect multiple revenue streams including electricity, CO 2 and industrial gas sales will drive attractive LCOE Intermittent Firm or Dispatchable G en 1 G en 2 Still emit 10% to 100% CO 2 and produce NO x and SO x Solar PV + storage Sola r P V - only Spark Spread Overview ⚫ Spark spread ($/MWh) = power price ($/MWh) – natural gas price ($/MMBtu) * heat rate (MMBtu/MWh) ⚫ The spark spread is commonly used to estimate the profitability of natural gas - fired electric generators ⚫ Spark spread ranges shown above are indicative of U.S. power markets (see slide 50 for detailed spark spread futures) After - Tax Levered IRR Change in Capex + 0% + 25% + 50% $10.00 14% 11% 8% $20.00 21% 17% 13% $30.00 26% 22% 17% $40.00 30% 26% 21% $50.00 34% 29% 24% Spark S p r ead $ / M W h
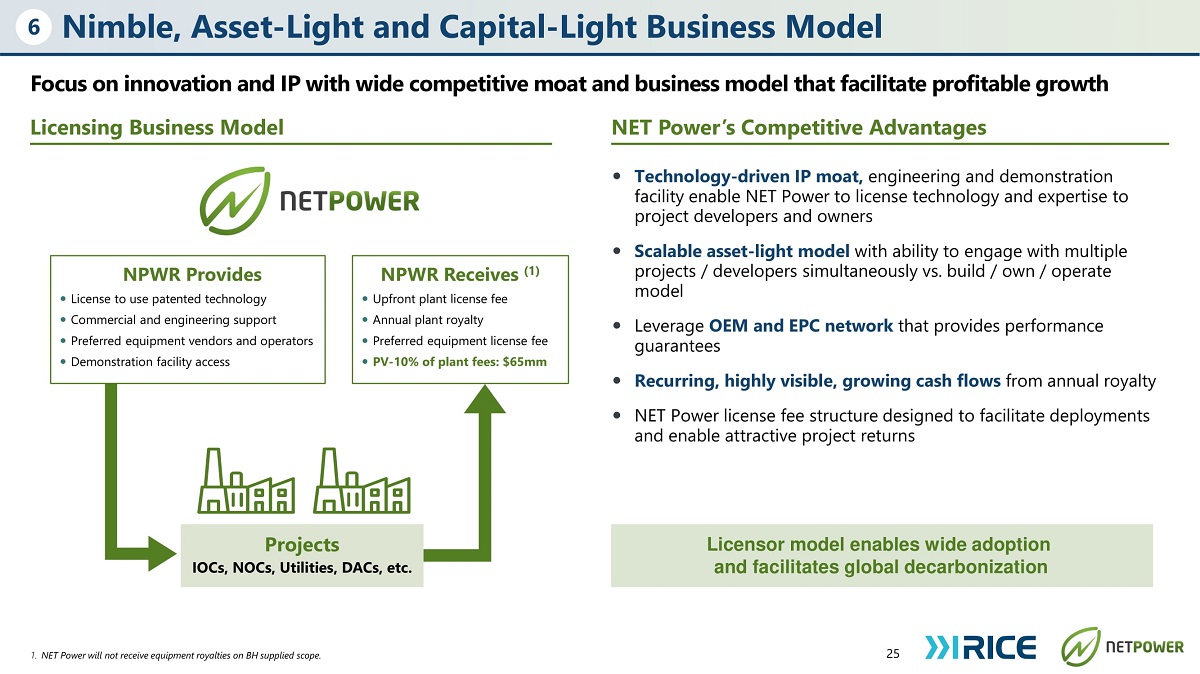
Nimble, Asset - Light and Capital - Light Business Model Focus on innovation and IP with wide competitive moat and business model that facilitate profitable growth Licensing Business Model NET Power’s Competitive Advantages 25 6 ⚫ Technology - driven IP moat, engineering and demonstration facility enable NET Power to license technology and expertise to project developers and owners ⚫ Scalable asset - light model with ability to engage with multiple projects / developers simultaneously vs. build / own / operate model ⚫ Leverage OEM and EPC network that provides performance guarantees ⚫ Recurring, highly visible, growing cash flows from annual royalty ⚫ NET Power license fee structure designed to facilitate deployments and enable attractive project returns Licensor model enables wide adoption and facilitates global decarbonization NPWR Receives (1) ⚫ Upfront plant license fee ⚫ Annual plant royalty ⚫ Preferred equipment license fee ⚫ PV - 10% of plant fees: $65mm NPWR Provides ⚫ License to use patented technology ⚫ Commercial and engineering support ⚫ Preferred equipment vendors and operators ⚫ Demonstration facility access Projects IOCs, NOCs, Utilities, DACs, etc. 1. NET Power will not receive equipment royalties on BH supplied scope.
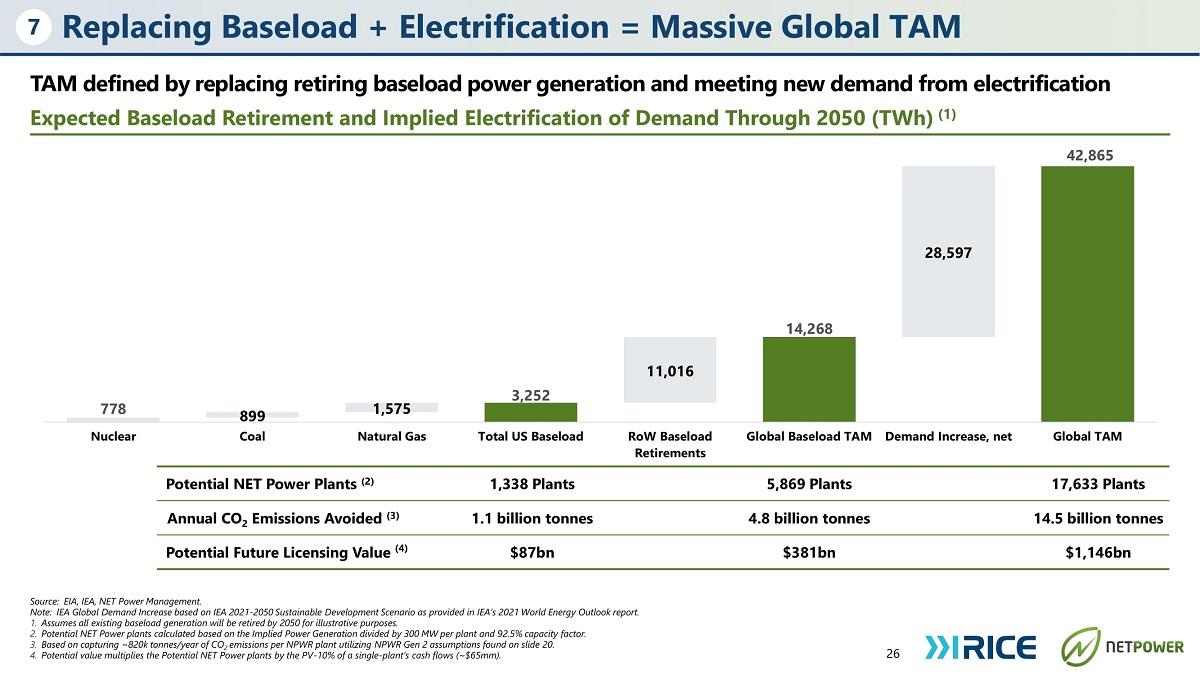
778 3,252 14,268 TAM defined by replacing retiring baseload power generation and meeting new demand from electrification Expected Baseload Retirement and Implied Electrification of Demand Through 2050 (TWh) (1) 42,865 899 1,575 11,016 28,597 Nuclear C o al Natural Gas Total US Baseload RoW Baseload Retirements Global Baseload TAM Demand Increase, net Global TAM Replacing Baseload + Electrification = Massive Global TAM 26 Source: EIA, IEA, NET Power Management. Note: IEA Global Demand Increase based on IEA 2021 - 2050 Sustainable Development Scenario as provided in IEA’s 2021 World Energy Outlook report. 1. Assumes all existing baseload generation will be retired by 2050 for illustrative purposes. 2. Potential NET Power plants calculated based on the Implied Power Generation divided by 300 MW per plant and 92.5% capacity factor. 3. Based on capturing ~820k tonnes/year of CO 2 emissions per NPWR plant utilizing NPWR Gen 2 assumptions found on slide 20. 4. Potential value multiplies the Potential NET Power plants by the PV - 10% of a single - plant’s cash flows (~$65mm). 7 Potential NET Power Plants (2) 1,338 Plants 5,869 Plants 17,633 Plants Annual CO 2 Emissions Avoided (3) 1.1 billion tonnes 4.8 billion tonnes 14.5 billion tonnes Potential Future Licensing Value (4) $87bn $381bn $1,146bn
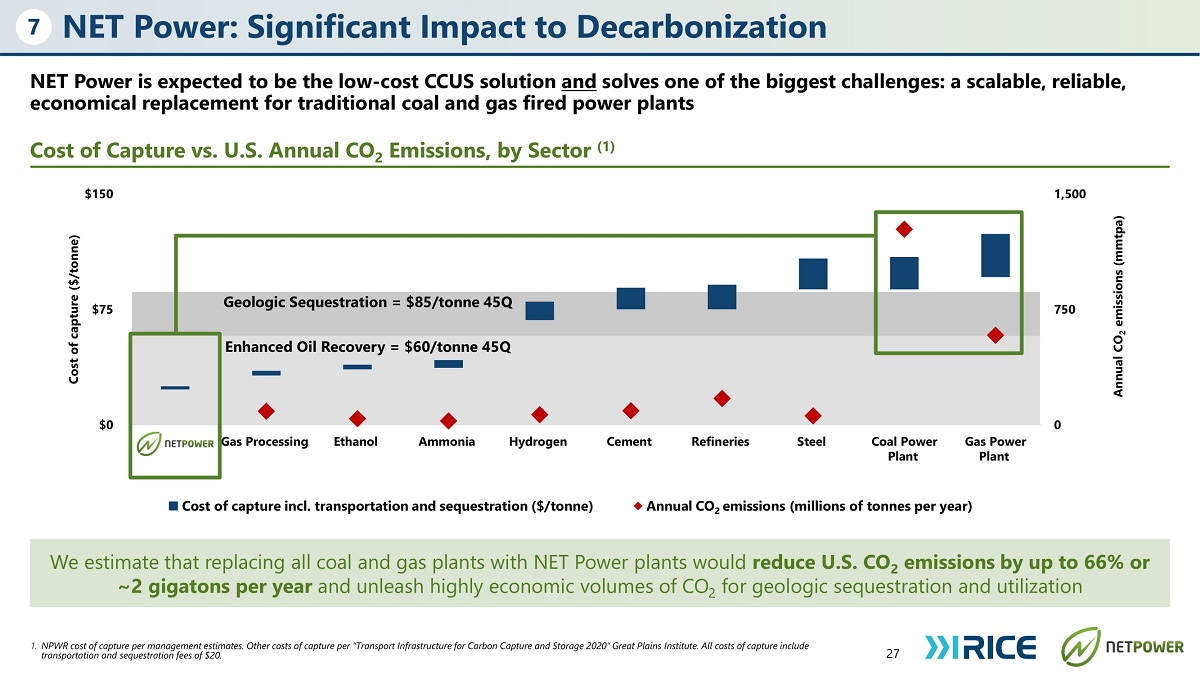
Geologic Sequestration = $85/tonne 45Q NET Power is expected to be the low - cost CCUS solution and solves one of the biggest challenges: a scalable, reliable, economical replacement for traditional coal and gas fired power plants Cost of Capture vs. U.S. Annual CO 2 Emissions, by Sector (1) 27 1. NPWR cost of capture per management estimates. Other costs of capture per “Transport Infrastructure for Carbon Capture and Storage 2020” Great Plains Institute. All costs of capture include transportation and sequestration fees of $20. We estimate that replacing all coal and gas plants with NET Power plants would reduce U.S. CO 2 emissions by up to 66% or ~2 gigatons per year and unleash highly economic volumes of CO 2 for geologic sequestration and utilization Enhanced Oil Recovery = $60/tonne 45Q 7 NET Power: Significant Impact to Decarbonization 0 750 1 , 5 00 $0 $75 $150 Gas Processing E t h anol A mmonia Hy d ro g en Cement Refineries S t eel Coal Power Plant Gas Power Plant Annual CO 2 emissions (mmtpa) Cost of capture ($/tonne) Cost of capture incl. transportation and sequestration ($/ton) Annual Industry CO2 emissions (millions of tons per year) Cost of capture incl. transportation and sequestration ($/tonne) Annual CO 2 emissions (millions of tonnes per year)
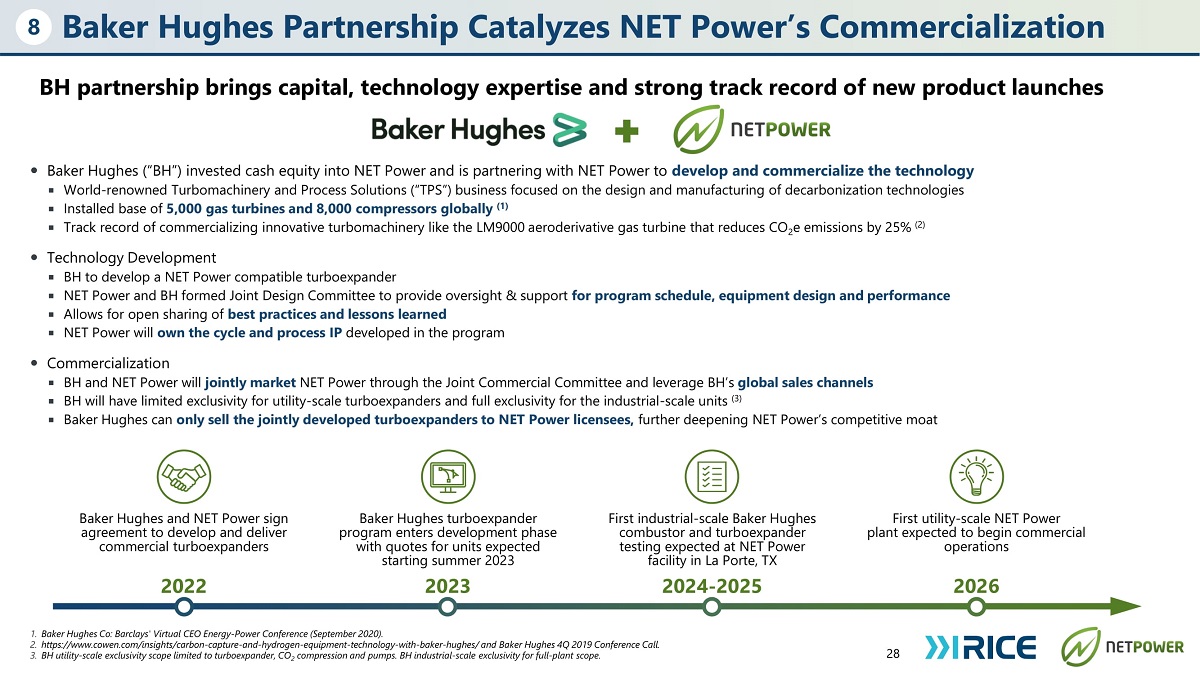
Baker Hughes Partnership Catalyzes NET Power’s Commercialization ⚫ Baker Hughes (“BH”) invested cash equity into NET Power and is partnering with NET Power to develop and commercialize the technology ◾ World - renowned Turbomachinery and Process Solutions (“TPS”) business focused on the design and manufacturing of decarbonization technologies ◾ Installed base of 5,000 gas turbines and 8,000 compressors globally (1) ◾ Track record of commercializing innovative turbomachinery like the LM9000 aeroderivative gas turbine that reduces CO 2 e emissions by 25% (2) ⚫ Technology Development ◾ BH to develop a NET Power compatible turboexpander ◾ NET Power and BH formed Joint Design Committee to provide oversight & support for program schedule, equipment design and performance ◾ Allows for open sharing of best practices and lessons learned ◾ NET Power will own the cycle and process IP developed in the program ⚫ Commercialization ◾ BH and NET Power will jointly market NET Power through the Joint Commercial Committee and leverage BH’s global sales channels ◾ BH will have limited exclusivity for utility - scale turboexpanders and full exclusivity for the industrial - scale units (3) ◾ Baker Hughes can only sell the jointly developed turboexpanders to NET Power licensees, further deepening NET Power’s competitive moat 1. Baker Hughes Co: Barclays' Virtual CEO Energy - Power Conference (September 2020). 2. https: //w ww .cowen.com/insights/carbon - capture - and - hydrogen - equipment - technology - with - baker - hughes/ and Baker Hughes 4Q 2019 Conference Call. 3. BH utility - scale exclusivity scope limited to turboexpander, CO 2 compression and pumps. BH industrial - scale exclusivity for full - plant scope. 28 8 Baker Hughes and NET Power sign agreement to develop and deliver commercial turboexpanders First utility - scale NET Power plant expected to begin commercial operations 2022 Baker Hughes turboexpander program enters development phase with quotes for units expected starting summer 2023 2023 2026 First industrial - scale Baker Hughes combustor and turboexpander testing expected at NET Power facility in La Porte, TX 2024 - 2025 BH partnership brings capital, technology expertise and strong track record of new product launches
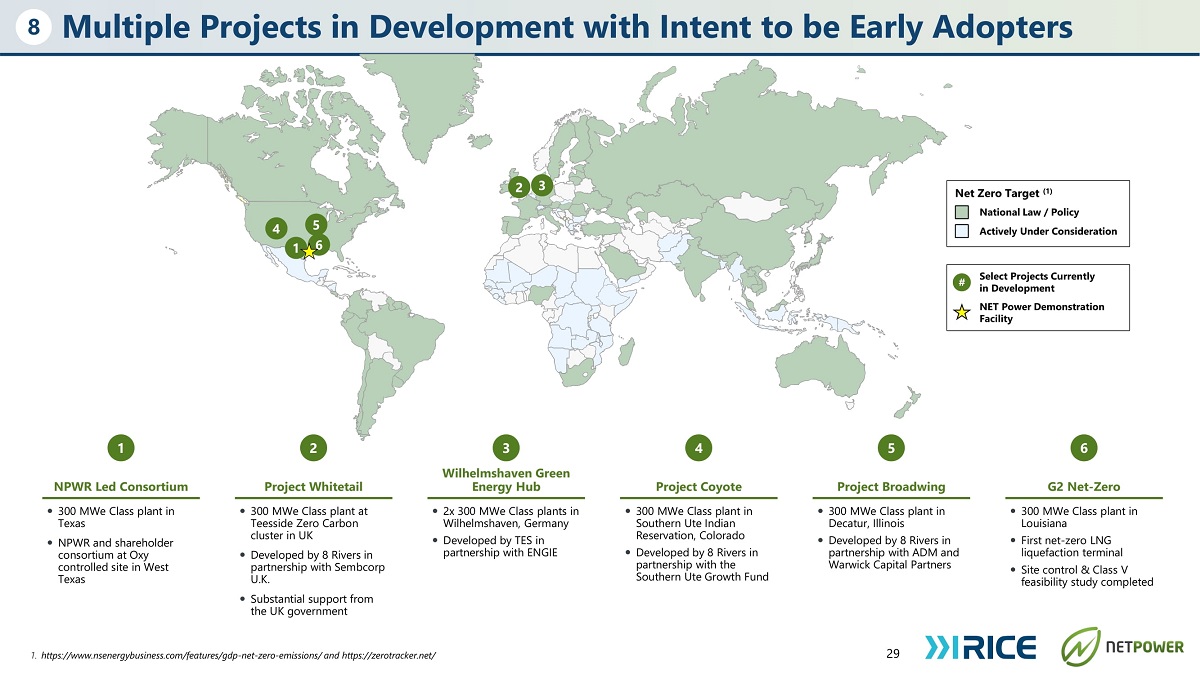
Multiple Projects in Development with Intent to be Early Adopters 29 1. https: //w ww .nsenergybusiness.com/features/gdp - net - zero - emissions/ and https://zerotracker.net/ 8 3 2 4 1 5 6 ⚫ 300 MWe Class plant in Texas ⚫ NPWR and shareholder consortium at Oxy controlled site in West Texas ⚫ 300 MWe Class plant at Teesside Zero Carbon cluster in UK ⚫ Developed by 8 Rivers in partnership with Sembcorp U.K. ⚫ Substantial support from the UK government ⚫ 2x 300 MWe Class plants in Wilhelmshaven, Germany ⚫ Developed by TES in partnership with ENGIE ⚫ 300 MWe Class plant in Southern Ute Indian Reservation, Colorado ⚫ Developed by 8 Rivers in partnership with the Southern Ute Growth Fund ⚫ 300 MWe Class plant in Decatur, Illinois ⚫ Developed by 8 Rivers in partnership with ADM and Warwick Capital Partners ⚫ 300 MWe Class plant in Louisiana ⚫ First net - zero LNG liq u e f a c t io n t e rmi n a l ⚫ Site control & Class V feasibility study completed 6 5 4 2 1 Net Zero Target (1) National Law / Policy Actively Under Consideration Select Projects Currently in Development NET Power Demonstration Facility # 3 Wilhelmshaven Green Energy Hub G2 Net - Zero Project Broadwing Project Coyote Project Whitetail NPWR Led Consortium
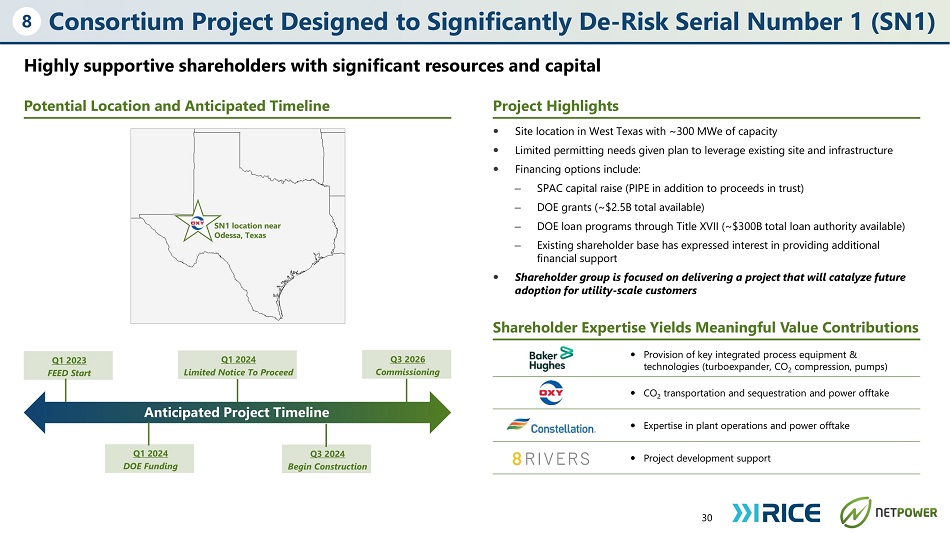
Consortium Project Designed to Significantly De - Risk Serial Number 1 (SN1) Highly supportive shareholders with significant resources and capital Potential Location and Anticipated Timeline Project Highlights 30 ⚫ Site location in West Texas with ~300 MWe of capacity ⚫ Limited permitting needs given plan to leverage existing site and infrastructure ⚫ Financing options include: – SPAC capital raise (PIPE in addition to proceeds in trust) – DOE grants (~$2.5B total available) – DOE loan programs through Title XVII (~$300B total loan authority available) – Existing shareholder base has expressed interest in providing additional financial support ⚫ Shareholder group is focused on delivering a project that will catalyze future adoption for utility - scale customers Anticipated Project Timeline Shareholder Expertise Yields Meaningful Value Contributions ⚫ Provision of key integrated process equipment & technologies (turboexpander, CO 2 compression, pumps) ⚫ CO 2 transportation and sequestration and power offtake ⚫ Expertise in plant operations and power offtake ⚫ Project development support SN1 location near Odessa, Texas Q1 2024 DOE Funding Q3 2024 Begin Construction Q3 2026 Commissioning Q1 2024 Limited Notice To Proceed Q1 2023 FEED Start 8
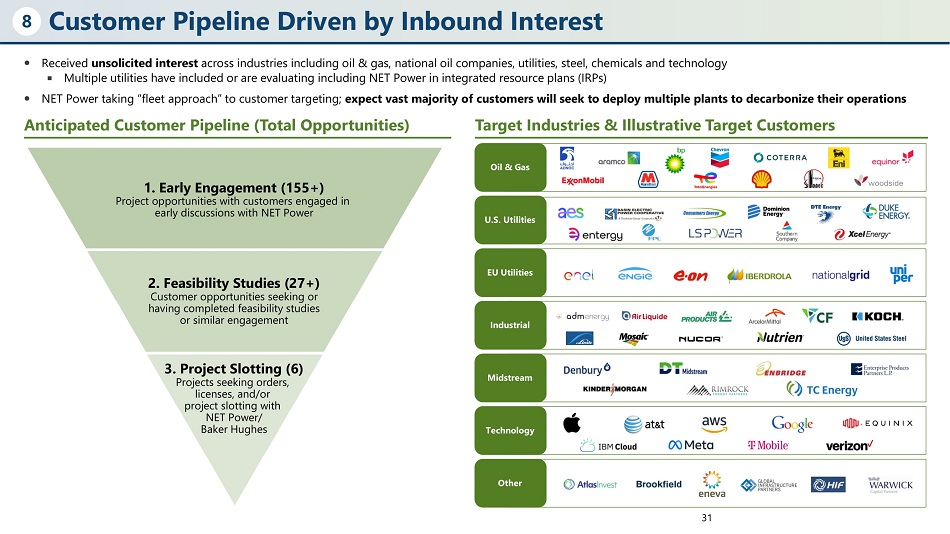
Customer Pipeline Driven by Inbound Interest ⚫ Received unsolicited interest across industries including oil & gas, national oil companies, utilities, steel, chemicals and technology ◾ Multiple utilities have included or are evaluating including NET Power in integrated resource plans (IRPs) ⚫ NET Power taking “fleet approach” to customer targeting; expect vast majority of customers will seek to deploy multiple plants to decarbonize their operations Anticipated Customer Pipeline (Total Opportunities) Target Industries & Illustrative Target Customers 8 1. Early Engagement (155+) Project opportunities with customers engaged in early discussions with NET Power 2. Feasibility Studies (27+) Customer opportunities seeking or having completed feasibility studies or similar engagement 3. Project Slotting (6) Projects seeking orders, licenses, and/or project slotting with NET Power/ Baker Hughes Oil & Gas U.S. Utilities E U Utilit i es Oth er In d u str ia l Midstream Technology 31
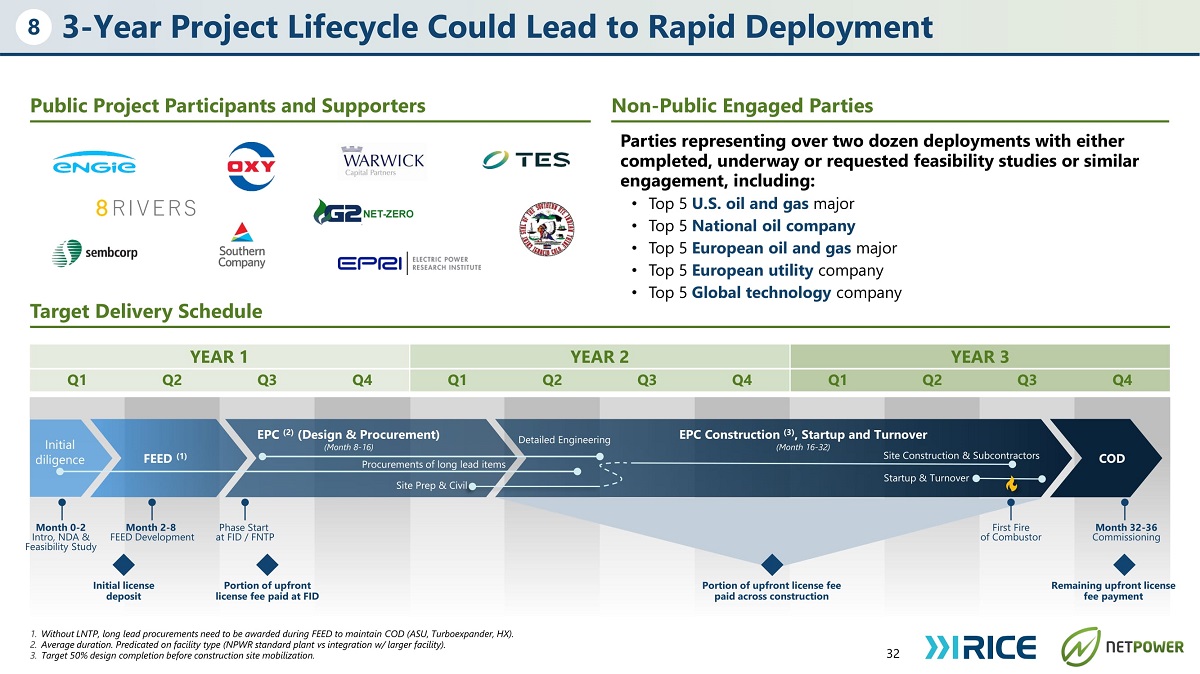
Y E A R 1 YEAR 2 YEAR 3 Q1 Q2 Q3 Q4 Q1 Q2 Q3 Q4 Q1 Q2 Q3 Q4 3 - Year Project Lifecycle Could Lead to Rapid Deployment 32 1. Without LNTP, long lead procurements need to be awarded during FEED to maintain COD (ASU, Turboexpander, HX). 2. Average duration. Predicated on facility type (NPWR standard plant vs integration w/ larger facility). 3. Target 50% design completion before construction site mobilization. Parties representing over two dozen deployments with either completed, underway or requested feasibility studies or similar engagement, including: • Top 5 U.S. oil and gas major • Top 5 National oil company • Top 5 European oil and gas major • Top 5 European utility company • Top 5 Global technology company COD Month 32 - 36 Commissioning FEED (1) Site Construction & Subcontractors Startup & Turnover Phase Start at FID / FNTP First Fire of Combustor Mon t h 0 - 2 Intro, NDA & Feasibility Study Month 2 - 8 FEED Development I n itia l lice n s e deposit Detailed Engineering EPC (2) (Design & Procurement) (Month 8 - 16) Procurements of long lead items Site Prep & Civil Portion of upfront license fee paid at FID EPC Construction (3) , Startup and Turnover ( M o nth 16 - 32) Portion of upfront license fee paid across construction Remaining upfront license fee payment Initial dilig e n c e 8 Public Project Participants and Supporters Non - Public Engaged Parties Target Delivery Schedule
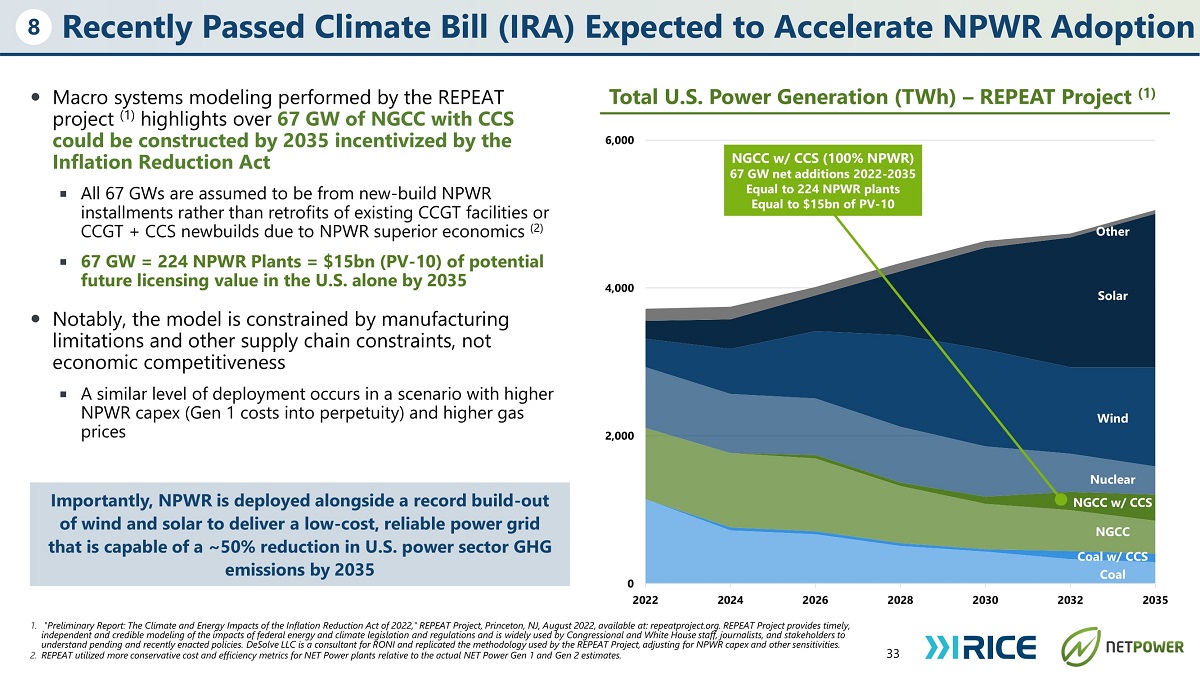
Recently Passed Climate Bill (IRA) Expected to Accelerate NPWR Adoption ⚫ Macro systems modeling performed by the REPEAT project (1) highlights over 67 GW of NGCC with CCS could be constructed by 2035 incentivized by the Inflation Reduction Act ◾ All 67 GWs are assumed to be from new - build NPWR installments rather than retrofits of existing CCGT facilities or CCGT + CCS newbuilds due to NPWR superior economics (2) ◾ 67 GW = 224 NPWR Plants = $15bn (PV - 10) of potential future licensing value in the U.S. alone by 2035 ⚫ Notably, the model is constrained by manufacturing limitations and other supply chain constraints, not economic competitiveness ◾ A similar level of deployment occurs in a scenario with higher NPWR capex (Gen 1 costs into perpetuity) and higher gas prices 8 33 0 202 2 202 4 2026 2, 0 0 0 4 , 0 00 6 , 0 00 2028 2030 Nuclear NGCC w/ CCS NGCC Coal w/ CCS Coal 2032 2035 Importantly, NPWR is deployed alongside a record build - out of wind and solar to deliver a low - cost, reliable power grid that is capable of a ~50% reduction in U.S. power sector GHG emissions by 2035 Total U.S. Power Generation (TWh) – REPEAT Project (1) W ind Solar Other NGCC w/ CCS (100% NPWR) 67 GW net additions 2022 - 2035 Equal to 224 NPWR plants Equal to $15bn of PV - 10 1. "Preliminary Report: The Climate and Energy Impacts of the Inflation Reduction Act of 2022," REPEAT Project, Princeton, NJ, August 2022, available at: repeatproject.org. REPEAT Project provides timely, independent and credible modeling of the impacts of federal energy and climate legislation and regulations and is widely used by Congressional and White House staff, journalists, and stakeholders to understand pending and recently enacted policies. DeSolve LLC is a consultant for RONI and replicated the methodology used by the REPEAT Project, adjusting for NPWR capex and other sensitivities. 2. REPEAT utilized more conservative cost and efficiency metrics for NET Power plants relative to the actual NET Power Gen 1 and Gen 2 estimates.
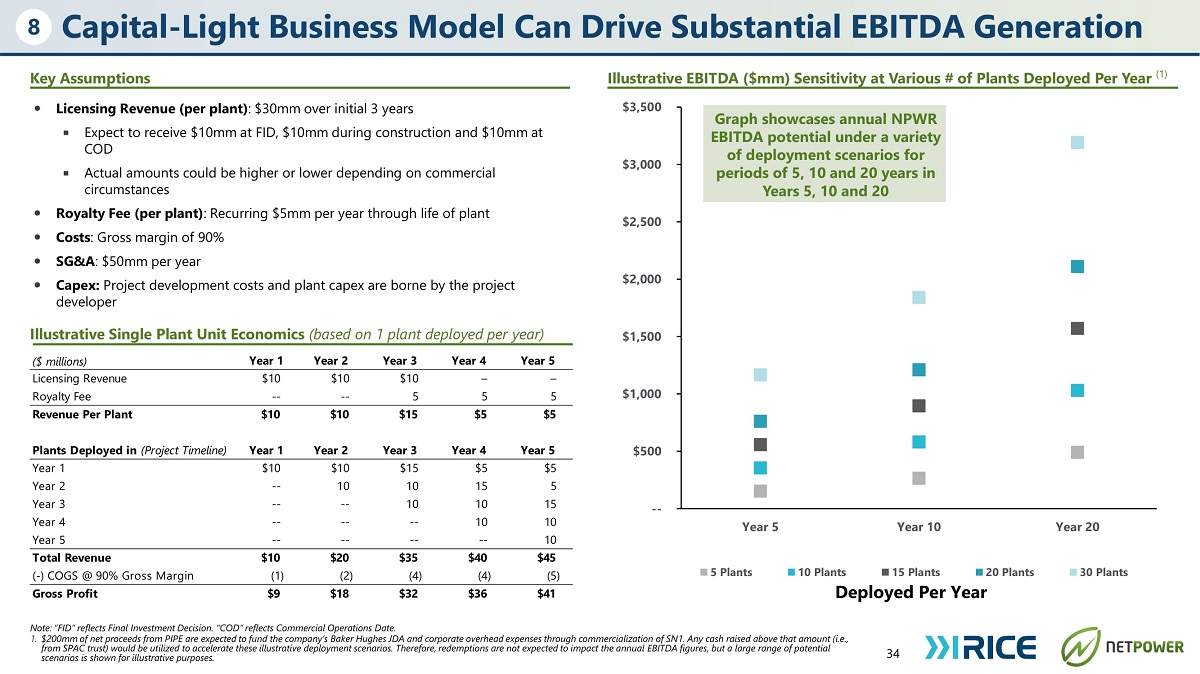
Capital - Light Business Model Can Drive Substantial EBITDA Generation 34 8 Illustrative EBITDA ($mm) Sensitivity at Various # of Plants Deployed Per Year (1) Key Assumptions ⚫ Licensing Revenue (per plant) : $30mm over initial 3 years ◾ Expect to receive $10mm at FID, $10mm during construction and $10mm at COD ◾ Actual amounts could be higher or lower depending on commercial circumstances ⚫ Royalty Fee (per plant) : Recurring $5mm per year through life of plant ⚫ Costs : Gross margin of 90% ⚫ SG&A : $50mm per year ⚫ Capex: Project development costs and plant capex are borne by the project developer I llustrative Single Plant Unit Economics (based on 1 plant deployed per year) ($ millions) Year 1 Year 2 Year 3 Year 4 Year 5 Licensing Revenue $10 $10 $10 – – Royalty Fee -- -- 5 5 5 Revenue Per Plant $10 $10 $15 $5 $5 Plants Deployed in (Project Timeline) Year 1 Year 2 Year 3 Year 4 Year 5 Year 1 $10 $10 $15 $5 $5 Year 2 -- 10 10 15 5 Year 3 -- -- 10 10 15 Year 4 -- -- -- 10 10 Year 5 -- -- -- -- 10 Total Revenue $10 $20 $35 $40 $45 ( - ) COGS @ 90% Gross Margin (1) (2) (4) (4) (5) Gross Profit $9 $18 $32 $36 $41 -- $500 $1 , 000 $1 , 500 $2 , 000 $2 , 500 $3 , 000 $ 3 , 5 00 Year 5 Year 10 Year 20 5 Pl a nts 1 0 Pl a nt s 1 5 Pl a nts 2 0 Pl a nts 3 0 Pl a nts Deployed Per Year Graph showcases annual NPWR EBITDA potential under a variety of deployment scenarios for periods of 5, 10 and 20 years in Years 5, 10 and 20 Note: “FID” reflects Final Investment Decision. “COD” reflects Commercial Operations Date. 1. $200mm of net proceeds from PIPE are expected to fund the company’s Baker Hughes JDA and corporate overhead expenses through commercialization of SN1. Any cash raised above that amount (i.e., from SPAC trust) would be utilized to accelerate these illustrative deployment scenarios. Therefore, redemptions are not expected to impact the annual EBITDA figures, but a large range of potential scenarios is shown for illustrative purposes.
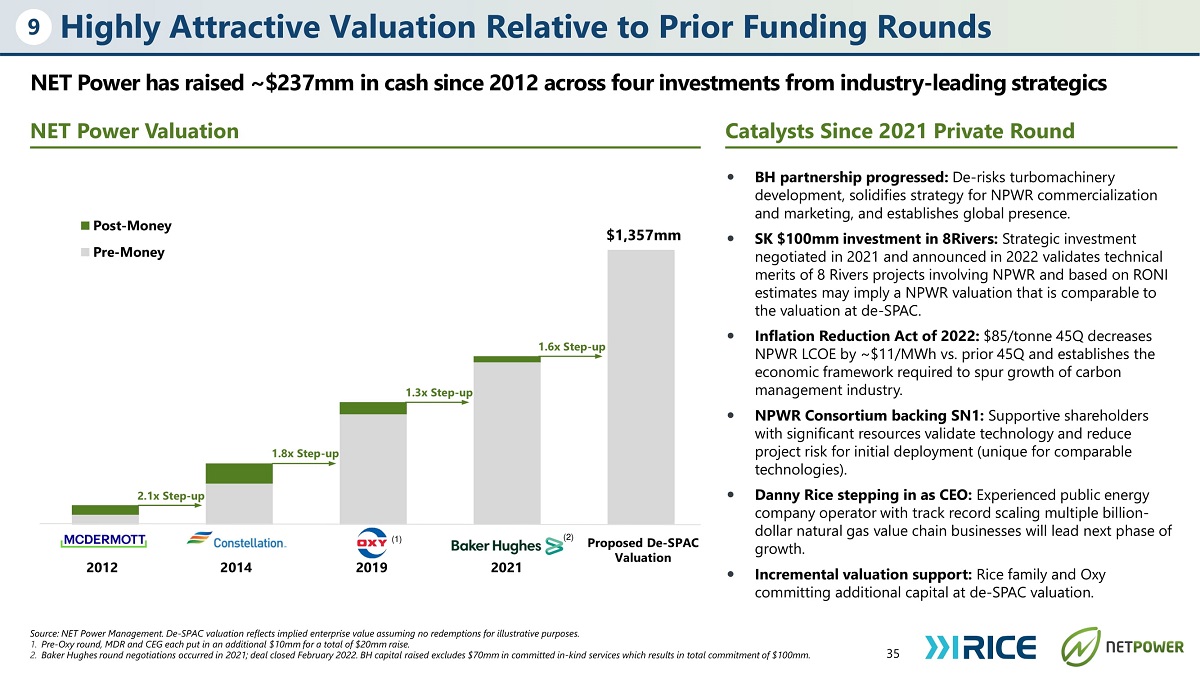
Highly Attractive Valuation Relative to Prior Funding Rounds NET Power has raised ~$237mm in cash since 2012 across four investments from industry - leading strategics NET Power Valuation Catalysts Since 2021 Private Round 35 Source: NET Power Management. De - SPAC valuation reflects implied enterprise value assuming no redemptions for illustrative purposes. 1. Pre - Oxy round, MDR and CEG each put in an additional $10mm for a total of $20mm raise. 2. Baker Hughes round negotiations occurred in 2021; deal closed February 2022. BH capital raised excludes $70mm in committed in - kind services which results in total commitment of $100mm. 9 $1,357mm Post - Money Pre - Money 2.1x Step - up (2) 2012 2014 2019 2021 Proposed De - SPAC Valuation (1) 1.3x Step - up 1.6x Step - up 1.8x Step - up ⚫ BH partnership progressed: De - risks turbomachinery development, solidifies strategy for NPWR commercialization and marketing, and establishes global presence. ⚫ SK $100mm investment in 8Rivers: Strategic investment negotiated in 2021 and announced in 2022 validates technical merits of 8 Rivers projects involving NPWR and based on RONI estimates may imply a NPWR valuation that is comparable to the valuation at de - SPAC. ⚫ Inflation Reduction Act of 2022: $85/tonne 45Q decreases NPWR LCOE by ~$11/MWh vs. prior 45Q and establishes the economic framework required to spur growth of carbon management industry. ⚫ NPWR Consortium backing SN1: Supportive shareholders with significant resources validate technology and reduce project risk for initial deployment (unique for comparable technologies). ⚫ Danny Rice stepping in as CEO: Experienced public energy company operator with track record scaling multiple billion - dollar natural gas value chain businesses will lead next phase of growth. ⚫ Incremental valuation support: Rice family and Oxy committing additional capital at de - SPAC valuation.
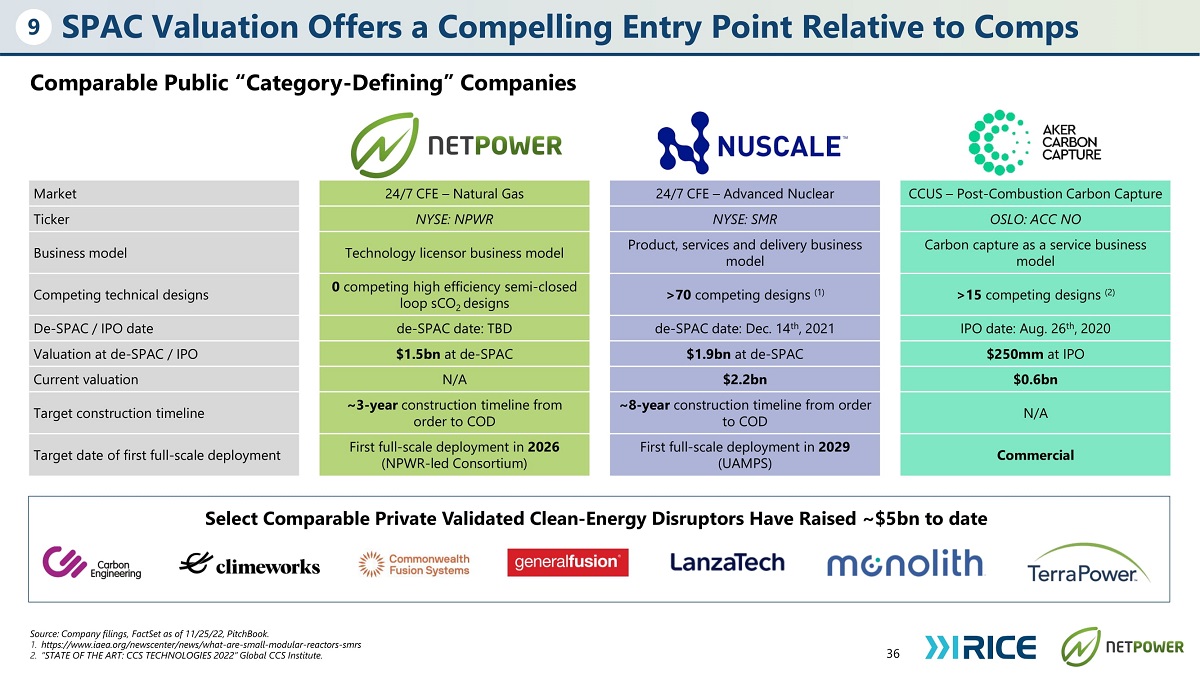
36 Source: Company filings, FactSet as of 11/25/22, PitchBook. 1. https: //w ww .iaea.org/newscenter/news/what - are - small - modular - reactors - smrs 2. “STATE OF THE ART: CCS TECHNOLOGIES 2022” Global CCS Institute. 9 SPAC Valuation Offers a Compelling Entry Point Relative to Comps Comparable Public “Category - Defining” Companies Market 24/7 CFE – Natural Gas 24/7 CFE – Advanced Nuclear CCUS – Post - Combustion Carbon Capture T ic ker NYSE: NPWR NYSE: SMR OSLO: ACC NO Bus i ness mod el Technology licensor business model Product, services and delivery business model Carbon capture as a service business model Competing technical designs 0 competing high efficiency semi - closed loop sCO 2 designs >70 competing designs (1) >15 competing designs (2) De - SPAC / IPO date de - SPAC date: TBD de - SPAC date: Dec. 14 th , 2021 IPO date: Aug. 26 th , 2020 Valuation at de - SPAC / IPO $1.5bn at de - SPAC $1.9bn at de - SPAC $250mm at IPO Current valuation N/A $2.2bn $0.6bn Target construction timeline ~3 - year construction timeline from order to COD ~8 - year construction timeline from order to COD N/A Target date of first full - scale deployment First full - scale deployment in 2026 (NPWR - led Consortium) First full - scale deployment in 2029 (UAMPS) Co m me r c i al Select Comparable Private Validated Clean - Energy Disruptors Have Raised ~$5bn to date
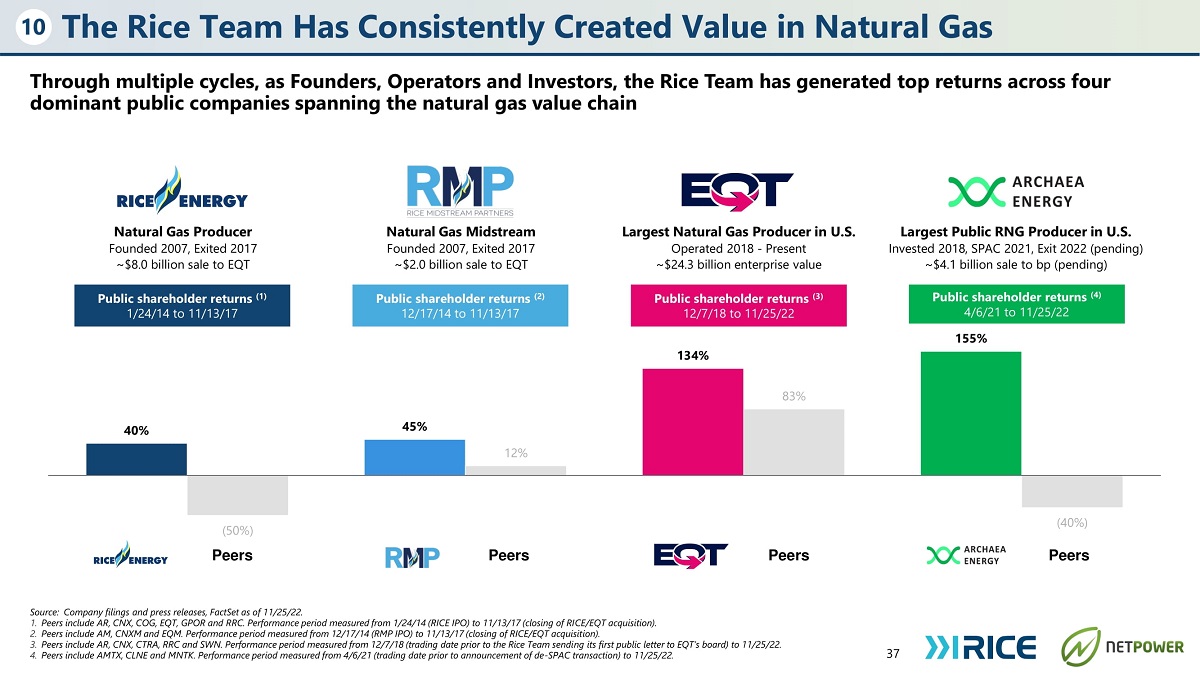
40% 45% 134% 83% 155% (5 0 %) Peers 12% (4 0 %) Through multiple cycles, as Founders, Operators and Investors, the Rice Team has generated top returns across four dominant public companies spanning the natural gas value chain Source: Company filings and press releases, FactSet as of 11/25/22. 1. Peers include AR, CNX, COG, EQT, GPOR and RRC. Performance period measured from 1/24/14 (RICE IPO) to 11/13/17 (closing of RICE/EQT acquisition). 2. Peers include AM, CNXM and EQM. Performance period measured from 12/17/14 (RMP IPO) to 11/13/17 (closing of RICE/EQT acquisition). 3. Peers include AR, CNX, CTRA, RRC and SWN. Performance period measured from 12/7/18 (trading date prior to the Rice Team sending its first public letter to EQT’s board) to 11/25/22. 4. Peers include AMTX, CLNE and MNTK. Performance period measured from 4/6/21 (trading date prior to announcement of de - SPAC transaction) to 11/25/22. 10 The Rice Team Has Consistently Created Value in Natural Gas Natural Gas Producer Founded 2007, Exited 2017 ~$8.0 billion sale to EQT Na t u r a l G as Mid s t r e a m Founded 2007, Exited 2017 ~$2.0 billion sale to EQT Largest Natural Gas Producer in U.S. Operated 2018 - Present ~$24.3 billion enterprise value Largest Public RNG Producer in U.S. Invested 2018, SPAC 2021, Exit 2022 (pending) ~$4.1 billion sale to bp (pending) Public shareholder returns (1) 1/24/14 to 11/13/17 Public shareholder returns (2) 12/17/14 to 11/13/17 Public shareholder returns (3) 12/7/18 to 11/25/22 Public shareholder returns (4) 4/6/21 to 11/25/22 P eers P eers P eers 37
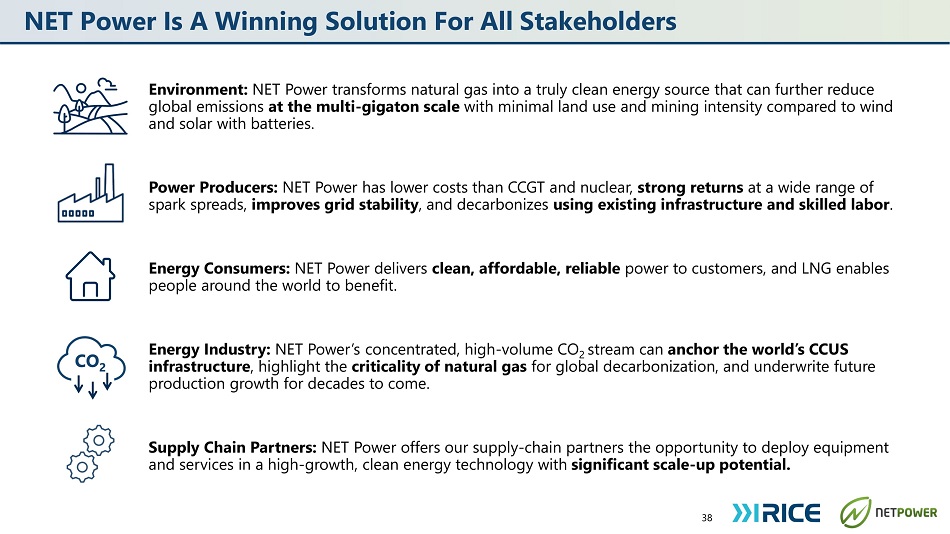
NET Power Is A Winning Solution For All Stakeholders Environment: NET Power transforms natural gas into a truly clean energy source that can further reduce global emissions at the multi - gigaton scale with minimal land use and mining intensity compared to wind and solar with batteries. Power Producers: NET Power has lower costs than CCGT and nuclear, strong returns at a wide range of spark spreads, improves grid stability , and decarbonizes using existing infrastructure and skilled labor . Energy Consumers: NET Power delivers clean, affordable, reliable power to customers, and LNG enables people around the world to benefit. Energy Industry: NET Power’s concentrated, high - volume CO 2 stream can anchor the world’s CCUS infrastructure , highlight the criticality of natural gas for global decarbonization, and underwrite future production growth for decades to come. Supply Chain Partners: NET Power offers our supply - chain partners the opportunity to deploy equipment and services in a high - growth, clean energy technology with significant scale - up potential. 38 CO 2
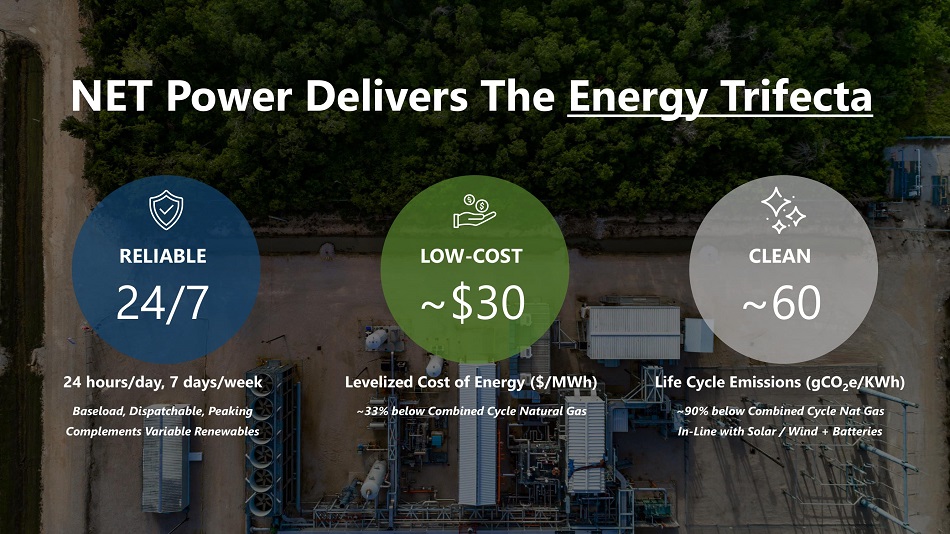
RELIABLE 24/7 24 hours/day, 7 days/week Baseload, Dispatchable, Peaking Complements Variable Renewables LOW - COST ~$30 Levelized Cost of Energy ($/MWh) ~33% below Combined Cycle Natural Gas CLEAN ~60 Life Cycle Emissions (gCO 2 e/KWh) ~90% below Combined Cycle Nat Gas In - Line with Solar / Wind + Batteries NET Power Delivers The Energy Trifecta
Appendix
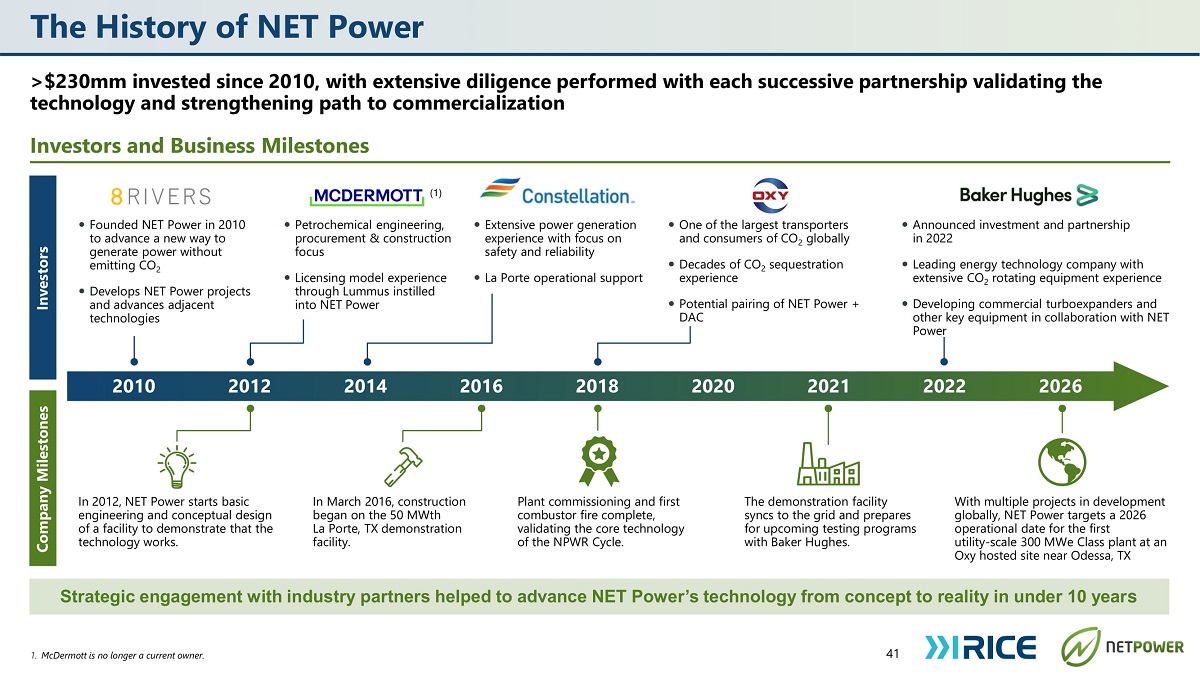
The History of NET Power >$230mm invested since 2010, with extensive diligence performed with each successive partnership validating the technology and strengthening path to commercialization Investors and Business Milestones 41 1. McDermott is no longer a current owner. Strategic engagement with industry partners helped to advance NET Power’s technology from concept to reality in under 10 years Investor s Company Milestones 2010 2012 2014 2016 2018 2020 2022 2021 2026 ⚫ Founded NET Power in 2010 to advance a new way to generate power without emitting CO 2 ⚫ Develops NET Power projects and advances adjacent technologies ⚫ Petrochemical engineering, procurement & construction focus ⚫ Licensing model experience through Lummus instilled into NET Power ⚫ Extensive power generation experience with focus on safety and reliability ⚫ La Porte operational support ⚫ One of the largest transporters and consumers of CO 2 globally ⚫ Decades of CO 2 sequestration experience ⚫ Potential pairing of NET Power + DAC ⚫ Announced investment and partnership in 2022 ⚫ Leading energy technology company with extensive CO 2 rotating equipment experience ⚫ Developing commercial turboexpanders and other key equipment in collaboration with NET Power (1) In 2012, NET Power starts basic engineering and conceptual design of a facility to demonstrate that the technology works. In March 2016, construction began on the 50 MWth La Porte, TX demonstration facility. Plant commissioning and first combustor fire complete, validating the core technology of the NPWR Cycle. The demonstration facility syncs to the grid and prepares for upcoming testing programs with Baker Hughes. With multiple projects in development globally, NET Power targets a 2026 operational date for the first utility - scale 300 MWe Class plant at an Oxy hosted site near Odessa, TX
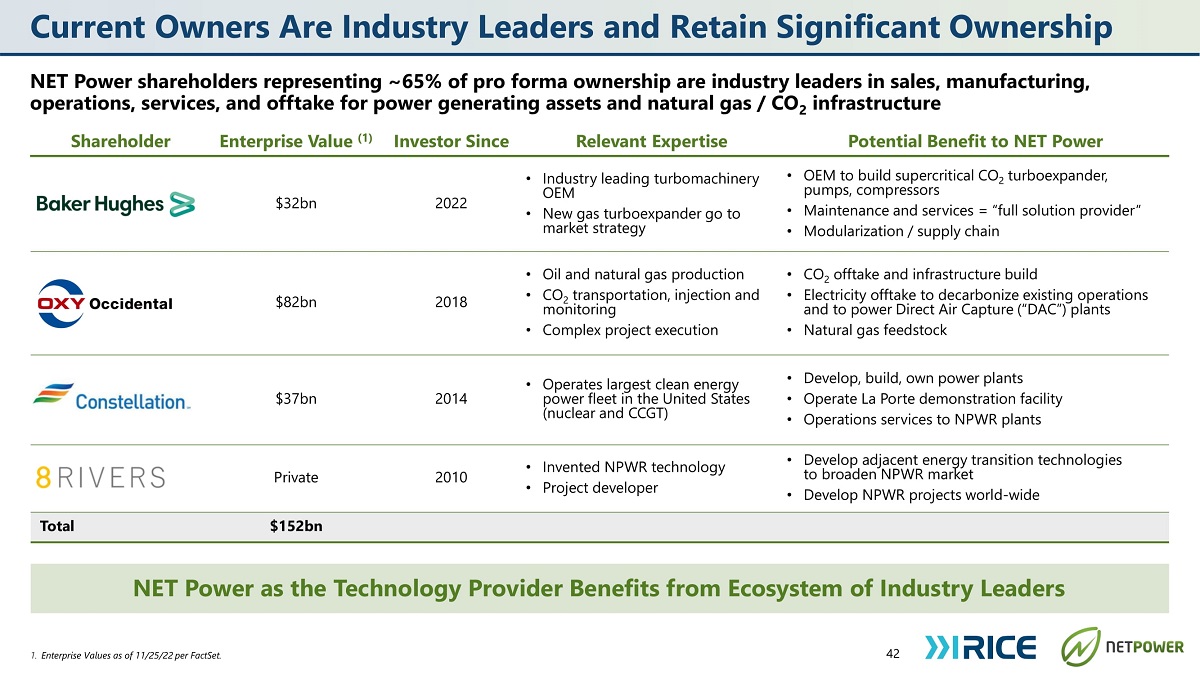
NET Power shareholders representing ~65% of pro forma ownership are industry leaders in sales, manufacturing, operations, services, and offtake for power generating assets and natural gas / CO 2 infrastructure 42 1. Enterprise Values as of 11/25/22 per FactSet. Shareholder Enterprise Value (1) Investor Since Relevant Expertise Potential Benefit to NET Power $32bn 2022 • Industry leading turbomachinery OEM • New gas turboexpander go to market strategy • OEM to build supercritical CO 2 turboexpander, pumps, compressors • Maintenance and services = “full solution provider” • Modularization / supply chain $82bn 2018 • Oil and natural gas production • CO 2 transportation, injection and monitoring • Complex project execution • CO 2 offtake and infrastructure build • Electricity offtake to decarbonize existing operations and to power Direct Air Capture (“DAC”) plants • Natural gas feedstock $37bn 2014 • Operates largest clean energy power fleet in the United States (nuclear and CCGT) • Develop, build, own power plants • Operate La Porte demonstration facility • Operations services to NPWR plants Private 2010 • Invented NPWR technology • Project developer • Develop adjacent energy transition technologies to broaden NPWR market • Develop NPWR projects world - wide Total $152bn NET Power as the Technology Provider Benefits from Ecosystem of Industry Leaders Current Owners Are Industry Leaders and Retain Significant Ownership
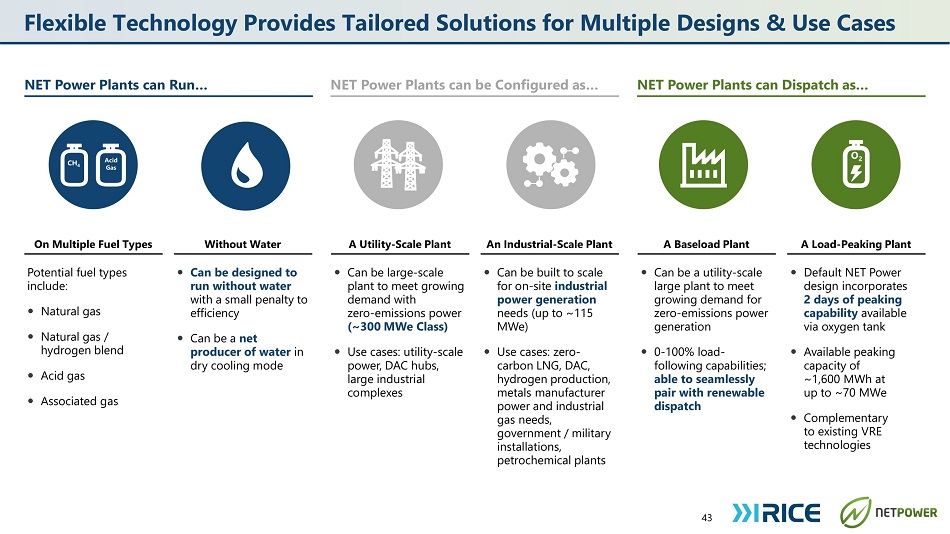
43 CH 4 Acid Gas O 2 On Multiple Fuel Types Without Water Potential fuel types include: ⚫ Natural gas ⚫ Natural gas / hyd r ogen bl e nd ⚫ Acid gas ⚫ Associated gas ⚫ Can be designed to run without water with a small penalty to efficiency ⚫ Can be a net producer of water in dry cooling mode ⚫ Can be large - scale plant to meet growing demand with zero - emissions power (~300 MWe Class) ⚫ Use cases: utility - scale power, DAC hubs, large industrial complexes ⚫ Can be built to scale for on - site industrial power generation needs (up to ~115 MWe) ⚫ Use cases: zero - carbon LNG, DAC, hydrogen production, metals manufacturer power and industrial gas needs, government / military installations, petrochemical plants ⚫ Can be a utility - scale large plant to meet growing demand for z er o - emi ss io n s p o we r generation ⚫ 0 - 100% load - fol l o win g ca p ab iliti es ; able to seamlessly pair with renewable dispatch ⚫ Default NET Power design incorporates 2 days of peaking capability available via oxygen tank ⚫ Available peaking capacity of ~1,600 MWh at up to ~70 MWe ⚫ C o m p l e me nta r y to existing VRE technologies NET Power Plants can Run… NET Power Plants can be Configured as… NET Power Plants can Dispatch as… A Utility - Scale Plant An Industrial - Scale Plant A Baseload Plant A Load - Peaking Plant exible Technology Provides Tailored Solutions for Multiple Designs & Use Cases
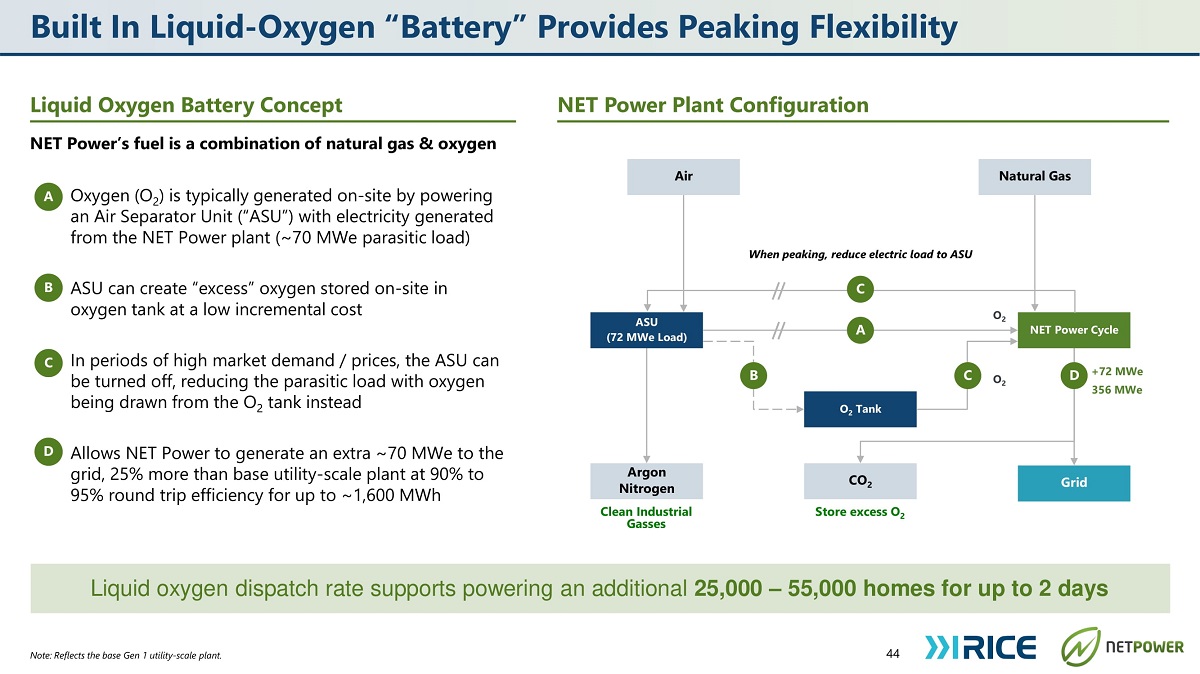
44 Note: Reflects the base Gen 1 utility - scale plant. NET Power’s fuel is a combination of natural gas & oxygen ASU can create “excess” oxygen stored on - site in oxygen tank at a low incremental cost In periods of high market demand / prices, the ASU can be turned off, reducing the parasitic load with oxygen being drawn from the O 2 tank instead Allows NET Power to generate an extra ~70 MWe to the grid, 25% more than base utility - scale plant at 90% to 95% round trip efficiency for up to ~1,600 MWh A ؘ Oxygen (O 2 ) is typically generated on - site by powering an Air Separator Unit (“ASU”) with electricity generated from the NET Power plant (~ 70 MWe parasitic load) B ؘ C ؘ D ؘ Liquid oxygen dispatch rate supports powering an additional 25,000 – 55,000 homes for up to 2 days +72 MWe 35 6 MWe Grid NET Power Cycle Air Natural Gas ASU (72 MWe Load) 2 O Tank Argon N itro g en CO 2 A B C C D O 2 When peaking, reduce electric load to ASU C l ean I n d us t rial Gasses Store excess O 2 O 2 Liquid Oxygen Battery Concept NET Power Plant Configuration Built In Liquid - Oxygen “Battery” Provides Peaking Flexibility
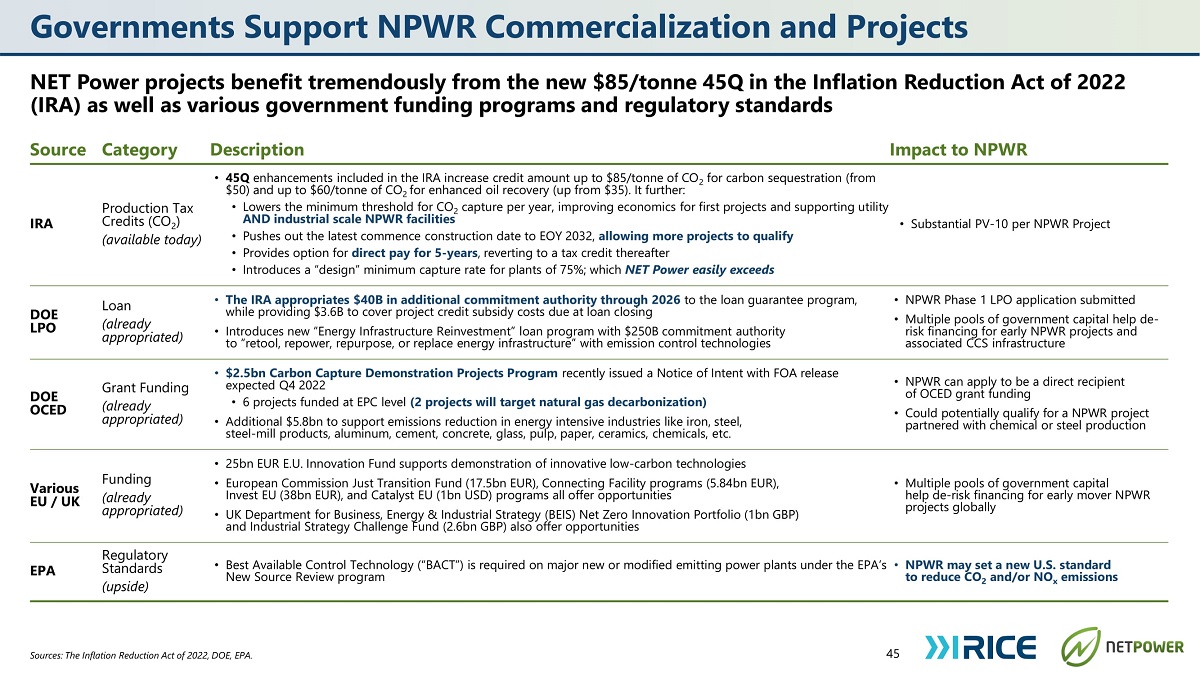
Governments Support NPWR Commercialization and Projects NET Power projects benefit tremendously from the new $85/tonne 45Q in the Inflation Reduction Act of 2022 (IRA) as well as various government funding programs and regulatory standards 45 Sources: The Inflation Reduction Act of 2022, DOE, EPA. Source Category Description Impact to NPWR IRA Production Tax Credits (CO 2 ) (available today) • 45Q enhancements included in the IRA increase credit amount up to $85/tonne of CO 2 for carbon sequestration (from $50) and up to $60/tonne of CO 2 for enhanced oil recovery (up from $35). It further: • Lowers the minimum threshold for CO 2 capture per year, improving economics for first projects and supporting utility AND industrial scale NPWR facilities • Pushes out the latest commence construction date to EOY 2032, allowing more projects to qualify • Provides option for direct pay for 5 - years , reverting to a tax credit thereafter • Introduces a “design” minimum capture rate for plants of 75%; which NET Power easily exceeds • Substantial PV - 10 per NPWR Project D OE LPO Loan (already appr opr iated) • The IRA appropriates $40B in additional commitment authority through 2026 to the loan guarantee program, while providing $3.6B to cover project credit subsidy costs due at loan closing • Introduces new “Energy Infrastructure Reinvestment” loan program with $250B commitment authority to “retool, repower, repurpose, or replace energy infrastructure” with emission control technologies • NPWR Phase 1 LPO application submitted • Multiple pools of government capital help de - risk financing for early NPWR projects and associated CCS infrastructure DOE OCED Grant Funding (already appr opr iated) • $2.5bn Carbon Capture Demonstration Projects Program recently issued a Notice of Intent with FOA release expected Q4 2022 • 6 projects funded at EPC level (2 projects will target natural gas decarbonization) • Additional $5.8bn to support emissions reduction in energy intensive industries like iron, steel, steel - mill products, aluminum, cement, concrete, glass, pulp, paper, ceramics, chemicals, etc. • NPWR can apply to be a direct recipient of OCED grant funding • Could potentially qualify for a NPWR project partnered with chemical or steel production Various EU / UK Funding (already appr opr iated) • 25bn EUR E.U. Innovation Fund supports demonstration of innovative low - carbon technologies • European Commission Just Transition Fund (17.5bn EUR), Connecting Facility programs (5.84bn EUR), Invest EU (38bn EUR), and Catalyst EU (1bn USD) programs all offer opportunities • UK Department for Business, Energy & Industrial Strategy (BEIS) Net Zero Innovation Portfolio (1bn GBP) and Industrial Strategy Challenge Fund (2.6bn GBP) also offer opportunities • Multiple pools of government capital help de - risk financing for early mover NPWR projects globally EPA Reg u l ato r y Standards (upside) • Best Available Control Technology (“BACT”) is required on major new or modified emitting power plants under the EPA’s New Source Review program • NPWR may set a new U.S. standard to reduce CO 2 and/or NO x emissions
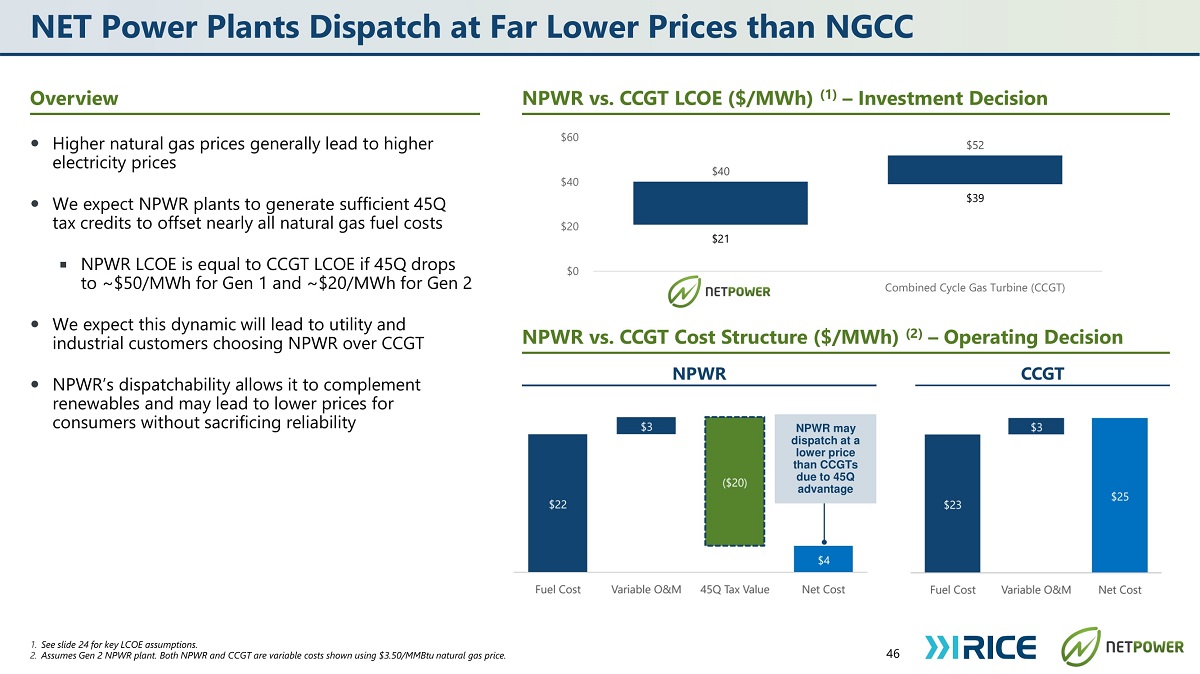
NET Power Plants Dispatch at Far Lower Prices than NGCC ⚫ Higher natural gas prices generally lead to higher electricity prices ⚫ We expect NPWR plants to generate sufficient 45Q tax credits to offset nearly all natural gas fuel costs ◾ NPWR LCOE is equal to CCGT LCOE if 45Q drops to ~$50/MWh for Gen 1 and ~$20/MWh for Gen 2 ⚫ We expect this dynamic will lead to utility and industrial customers choosing NPWR over CCGT ⚫ NPWR’s dispatchability allows it to complement renewables and may lead to lower prices for consumers without sacrificing reliability 1. See slide 24 for key LCOE assumptions. 2. Assumes Gen 2 NPWR plant. Both NPWR and CCGT are variable costs shown using $3.50/MMBtu natural gas price. 46 NPWR vs. CCGT LCOE ($/MWh) (1) – Investment Decision O v e r view NPWR vs. CCGT Cost Structure ($/MWh) (2) – Operating Decision NPWR CCGT $21 $39 $40 $52 $0 $ 2 0 $ 4 0 $ 6 0 NET Power Gen 2 Combined Cycle Gas Turbine (CCGT) NPWR may dispatch at a lower price than CCGTs due to 45Q advantage
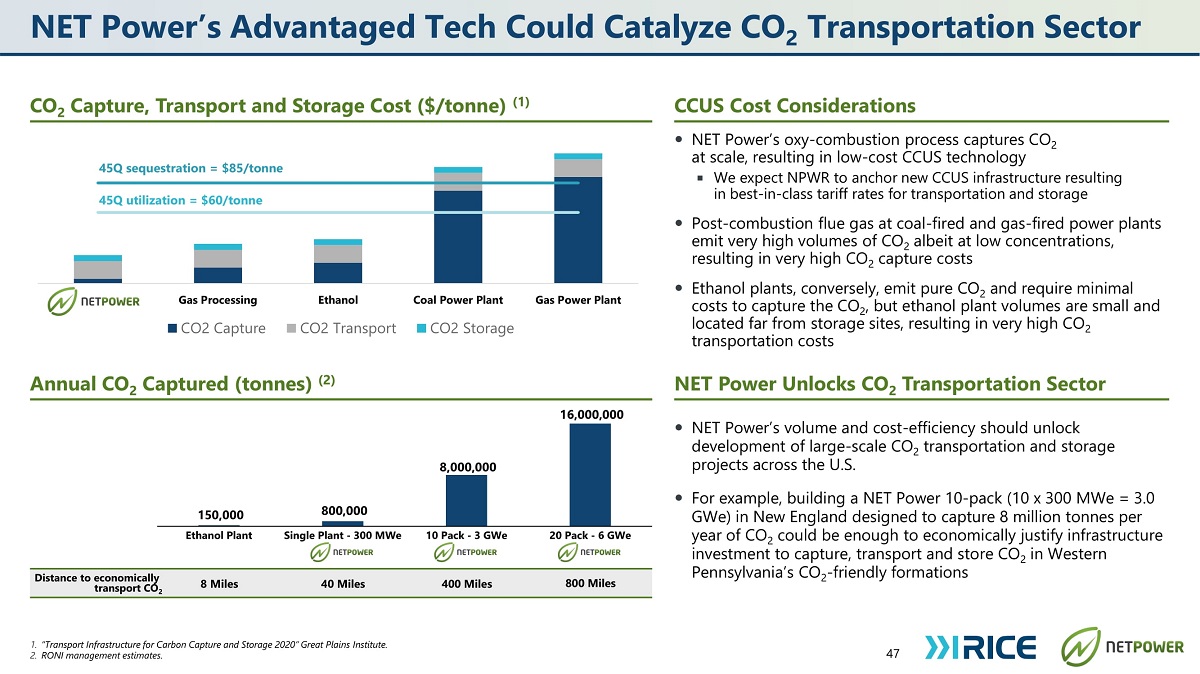
Gas Power Plant Ethanol CO2 Transport Gas Processing CO2 Capture NE T Po w e r Coal Power Plant CO2 Storage 150 , 000 8 0 0 , 0 00 8 , 000 , 000 16 , 000 , 000 Ethanol Plant Single Plant - 300 MWe 10 Pack - 3 GWe 20 Pack - 6 GWe NET Power’s Advantaged Tech Could Catalyze CO 2 Transportation Sector 1. “Transport Infrastructure for Carbon Capture and Storage 2020” Great Plains Institute. 2. R O N I m an a g eme n t es ti m at es. ⚫ NET Power’s oxy - combustion process captures CO 2 at scale, resulting in low - cost CCUS technology ◾ We expect NPWR to anchor new CCUS infrastructure resulting in best - in - class tariff rates for transportation and storage ⚫ Post - combustion flue gas at coal - fired and gas - fired power plants emit very high volumes of CO 2 albeit at low concentrations, resulting in very high CO 2 capture costs ⚫ Ethanol plants, conversely, emit pure CO 2 and require minimal costs to capture the CO 2 , but ethanol plant volumes are small and located far from storage sites, resulting in very high CO 2 transportation costs ⚫ NET Power’s volume and cost - efficiency should unlock development of large - scale CO 2 transportation and storage projects across the U.S. ⚫ For example, building a NET Power 10 - pack (10 x 300 MWe = 3.0 GWe) in New England designed to capture 8 million tonnes per year of CO 2 could be enough to economically justify infrastructure investment to capture, transport and store CO 2 in Western Pennsylvania’s CO 2 - friendly formations 45Q sequestration = $85/tonne 45Q utilization = $60/tonne 40 0 Mi l es 80 0 M il es 4 0 Mi l es 8 M il es Distance to economically transport CO 2 CO 2 Capture, Transport and Storage Cost ($/tonne) (1) CCUS Cost Considerations Annual CO 2 Captured (tonnes) (2) NET Power Unlocks CO 2 Transportation Sector 47
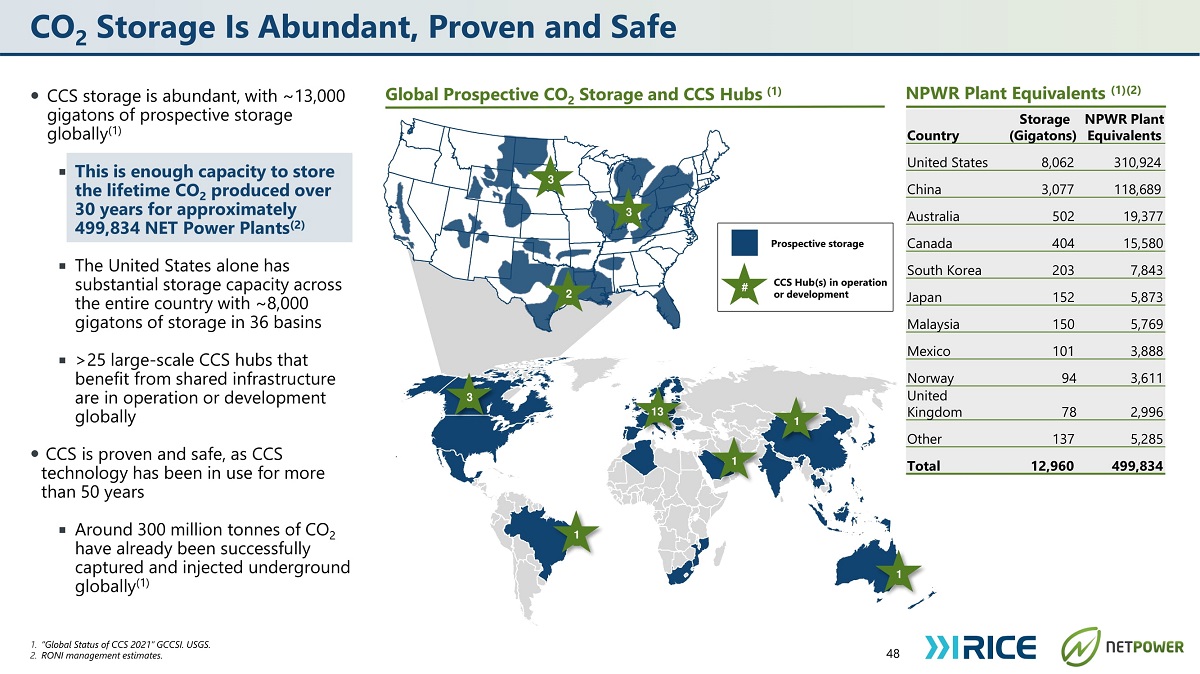
3 CO 2 Storage Is Abundant, Proven and Safe 1. “Global Status of CCS 2021” GCCSI. USGS. 2. R O N I m an a g eme n t es ti m at es. 48 Global Prospective CO 2 Storage and CCS Hubs (1) Country Storage (Gig a to n s ) NP WR P l a n t Equivalents United States 8,062 310,924 China 3,077 118,689 Australia 502 19,377 Canada 404 15,580 South Korea 203 7,843 Japan 152 5,873 Malaysia 150 5,769 Mexico 101 3,888 Norway 94 3,611 United Kin g d om 78 2,996 Other 137 5,285 Total 12,960 499,834 ⚫ CCS storage is abundant, with ~13,000 gigatons of prospective storage globally (1) ◾ This is enough capacity to store the lifetime CO 2 produced over 30 years for approximately 499,834 NET Power Plants (2) ◾ The United States alone has substantial storage capacity across the entire country with ~8,000 gigatons of storage in 36 basins ◾ >25 large - scale CCS hubs that benefit from shared infrastructure are in operation or development globally ⚫ CCS is proven and safe, as CCS technology has been in use for more than 50 years ◾ Around 300 million tonnes of CO 2 have already been successfully captured and injected underground globally (1) NPWR Plant Equivalents (1)(2) CCS Hub(s) in operation or development Prospective storage 3 3 13 2 1 1 1 1 #
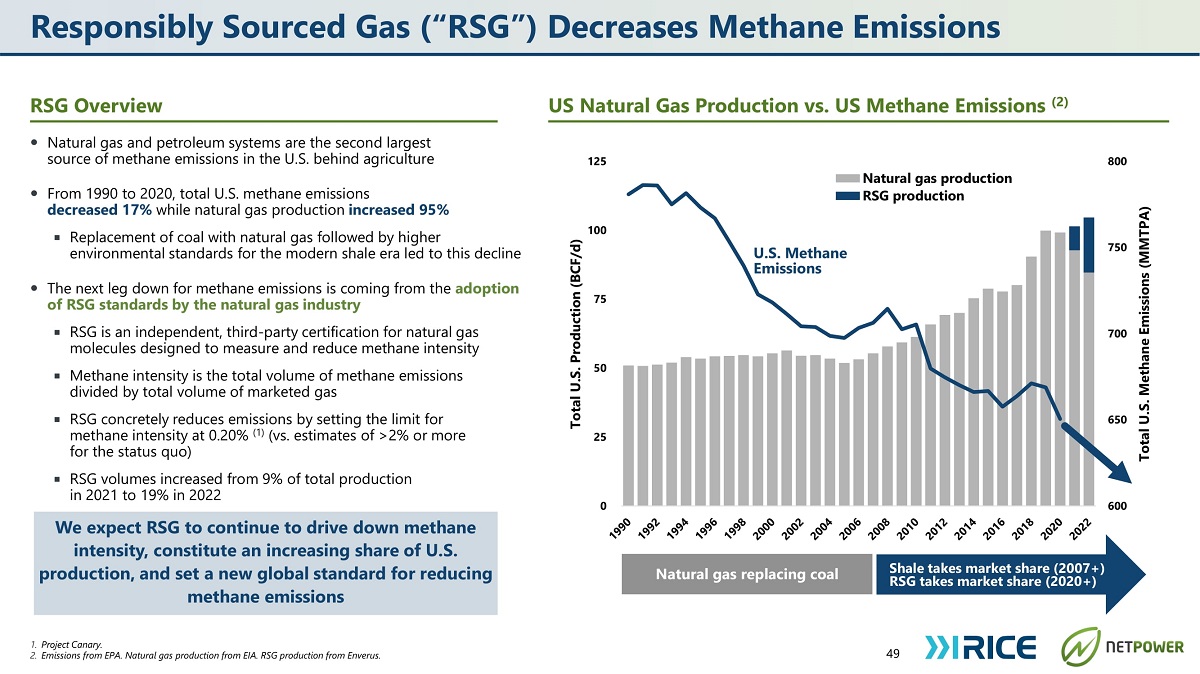
Responsibly Sourced Gas (“RSG”) Decreases Methane Emissions RSG Overview ⚫ Natural gas and petroleum systems are the second largest source of methane emissions in the U.S. behind agriculture ⚫ From 1990 to 2020, total U.S. methane emissions decreased 17% while natural gas production increased 95% ◾ Replacement of coal with natural gas followed by higher environmental standards for the modern shale era led to this decline ⚫ The next leg down for methane emissions is coming from the adoption of RSG standards by the natural gas industry ◾ RSG is an independent, third - party certification for natural gas molecules designed to measure and reduce methane intensity ◾ Methane intensity is the total volume of methane emissions divided by total volume of marketed gas ◾ RSG concretely reduces emissions by setting the limit for methane intensity at 0.20% (1) (vs. estimates of >2% or more for the status quo) ◾ RSG volumes increased from 9% of total production in 2021 to 19% in 2022 1. P r oj e c t Ca n a ry . 2. Emissions from EPA. Natural gas production from EIA. RSG production from Enverus. 600 650 700 750 800 0 25 50 75 100 125 Total U.S. Methane Emissions (MMTPA) Total U.S. Production (BCF/d) Natural gas production RSG production U.S. Methane Emissions Shale takes market share (2007+) RSG takes market share (2020+) Natural gas replacing coal US Natural Gas Production vs. US Methane Emissions (2) 49 We expect RSG to continue to drive down methane intensity, constitute an increasing share of U.S. production, and set a new global standard for reducing methane emissions
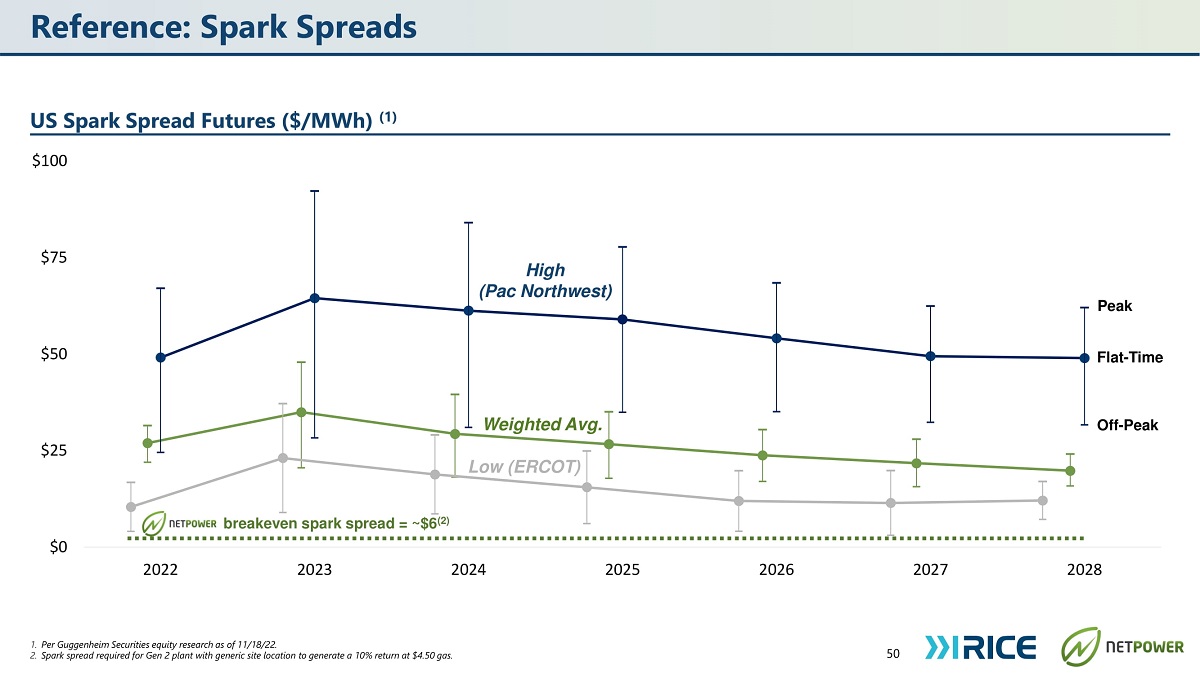
$0 $25 $50 $75 US Spark Spread Futures ($/MWh) (1) $100 2022 2023 2024 2025 2026 2027 2028 Reference: Spark Spreads 50 1. Per Guggenheim Securities equity research as of 11/18/22. 2. Spark spread required for Gen 2 plant with generic site location to generate a 10% return at $4.50 gas. High (Pac Northwest) W ei gh ted A v g . Peak Fla t - T ime Off - Peak Low (ERCOT) breakeven spark spread = ~$6 (2)
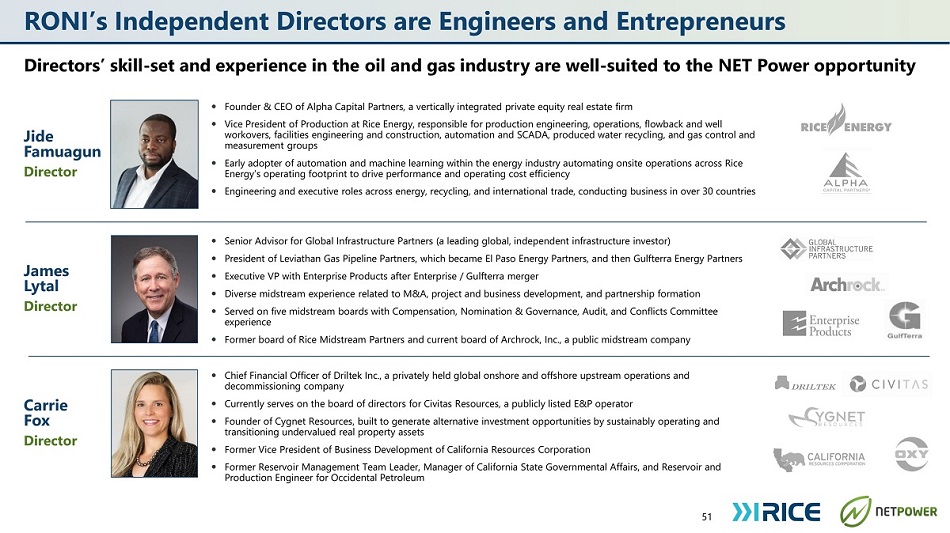
RONI’s Independent Directors are Engineers and Entrepreneurs Directors’ skill - set and experience in the oil and gas industry are well - suited to the NET Power opportunity ⚫ Founder & CEO of Alpha Capital Partners, a vertically integrated private equity real estate firm ⚫ Vice President of Production at Rice Energy, responsible for production engineering, operations, flowback and well workovers, facilities engineering and construction, automation and SCADA, produced water recycling, and gas control and measurement groups ⚫ Early adopter of automation and machine learning within the energy industry automating onsite operations across Rice Energy’s operating footprint to drive performance and operating cost efficiency ⚫ Engineering and executive roles across energy, recycling, and international trade, conducting business in over 30 countries ⚫ Senior Advisor for Global Infrastructure Partners (a leading global, independent infrastructure investor) ⚫ President of Leviathan Gas Pipeline Partners, which became El Paso Energy Partners, and then Gulfterra Energy Partners ⚫ Executive VP with Enterprise Products after Enterprise / Gulfterra merger ⚫ Diverse midstream experience related to M&A, project and business development, and partnership formation ⚫ Served on five midstream boards with Compensation, Nomination & Governance, Audit, and Conflicts Committee experience ⚫ Former board of Rice Midstream Partners and current board of Archrock, Inc., a public midstream company ⚫ Chief Financial Officer of Driltek Inc., a privately held global onshore and offshore upstream operations and decommissioning company ⚫ Currently serves on the board of directors for Civitas Resources, a publicly listed E&P operator ⚫ Founder of Cygnet Resources, built to generate alternative investment opportunities by sustainably operating and transitioning undervalued real property assets ⚫ Former Vice President of Business Development of California Resources Corporation ⚫ Former Reservoir Management Team Leader, Manager of California State Governmental Affairs, and Reservoir and Production Engineer for Occidental Petroleum Jide F amuag u n Director J ames Lytal Director Car r ie Fox Director 51
Appendix – Project Details
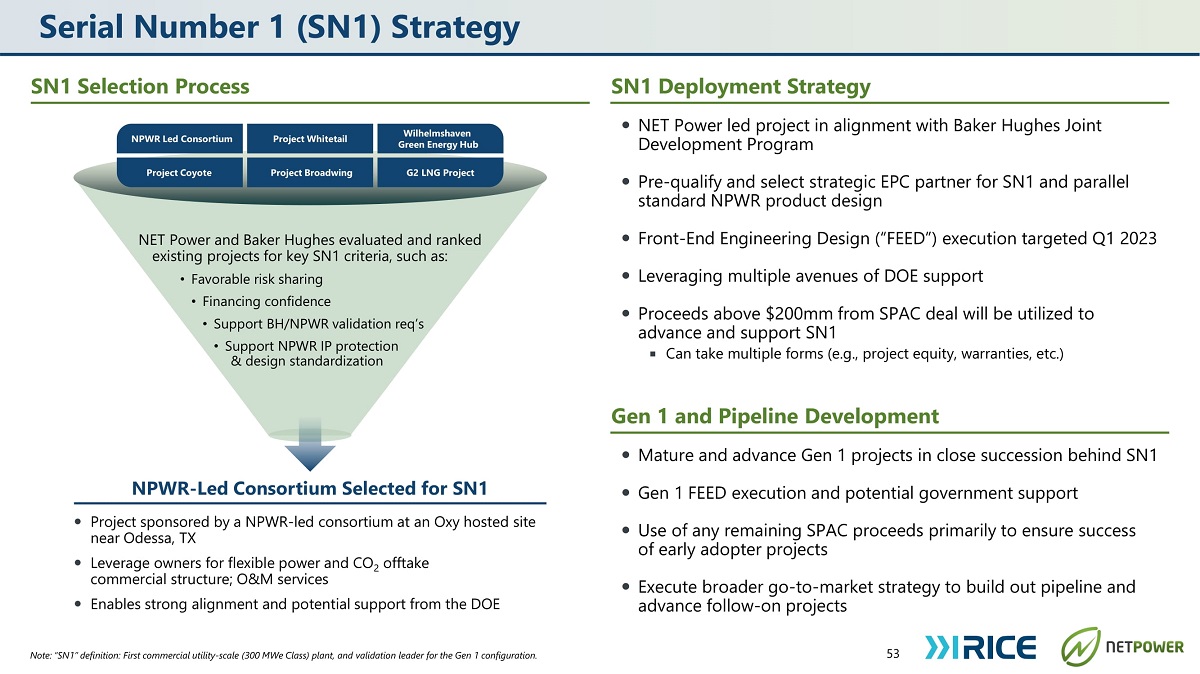
Pro jec t B ro adwing Wilhelmshaven Gre e n E n e rgy H ub Project Whitetail NPWR L ed C o ns o r t ium G2 LNG Project Pro jec t C o y ot e Serial Number 1 (SN1) Strategy NET Power and Baker Hughes evaluated and ranked existing projects for key SN1 criteria, such as: • Favorable risk sharing • Financing confidence • Support BH/NPWR validation req’s • Support NPWR IP protection & design standardization NPWR - Led Consortium Selected for SN1 ⚫ Project sponsored by a NPWR - led consortium at an Oxy hosted site near Odessa, TX ⚫ Leverage owners for flexible power and CO 2 offtake commercial structure; O&M services ⚫ Enables strong alignment and potential support from the DOE SN1 Selection Process SN1 Deployment Strategy ⚫ NET Power led project in alignment with Baker Hughes Joint Development Program ⚫ Pre - qualify and select strategic EPC partner for SN1 and parallel standard NPWR product design ⚫ Front - End Engineering Design (“FEED”) execution targeted Q1 2023 ⚫ Leveraging multiple avenues of DOE support ⚫ Proceeds above $200mm from SPAC deal will be utilized to advance and support SN1 ◾ Can take multiple forms (e.g., project equity, warranties, etc.) Gen 1 and Pipeline Development ⚫ Mature and advance Gen 1 projects in close succession behind SN1 ⚫ Gen 1 FEED execution and potential government support ⚫ Use of any remaining SPAC proceeds primarily to ensure success of early adopter projects ⚫ Execute broader go - to - market strategy to build out pipeline and advance follow - on projects 53 Note: “SN1” definition: First commercial utility - scale (300 MWe Class) plant, and validation leader for the Gen 1 configuration.
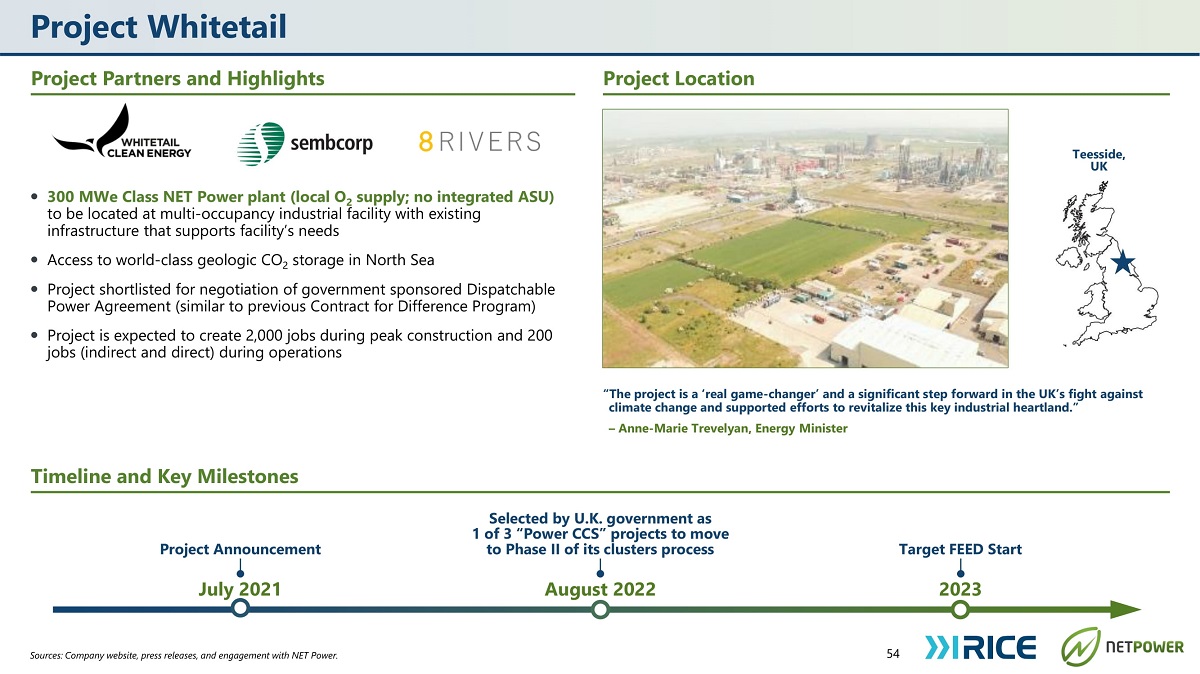
Project Whitetail Sources: Company website, press releases, and engagement with NET Power. Project Location Project Partners and Highlights ⚫ 300 MWe Class NET Power plant (local O 2 supply; no integrated ASU) to be located at multi - occupancy industrial facility with existing infrastructure that supports facility’s needs ⚫ Access to world - class geologic CO 2 storage in North Sea ⚫ Project shortlisted for negotiation of government sponsored Dispatchable Power Agreement (similar to previous Contract for Difference Program) ⚫ Project is expected to create 2,000 jobs during peak construction and 200 jobs (indirect and direct) during operations “The project is a ‘real game - changer’ and a significant step forward in the UK’s fight against climate change and supported efforts to revitalize this key industrial heartland.” – Anne - Marie Trevelyan, Energy Minister Timeline and Key Milestones 54 Teesside, UK Project Announcement Selected by U.K. government as 1 of 3 “Power CCS” projects to move to Phase II of its clusters process Target FEED Start August 2022 July 2021 2023
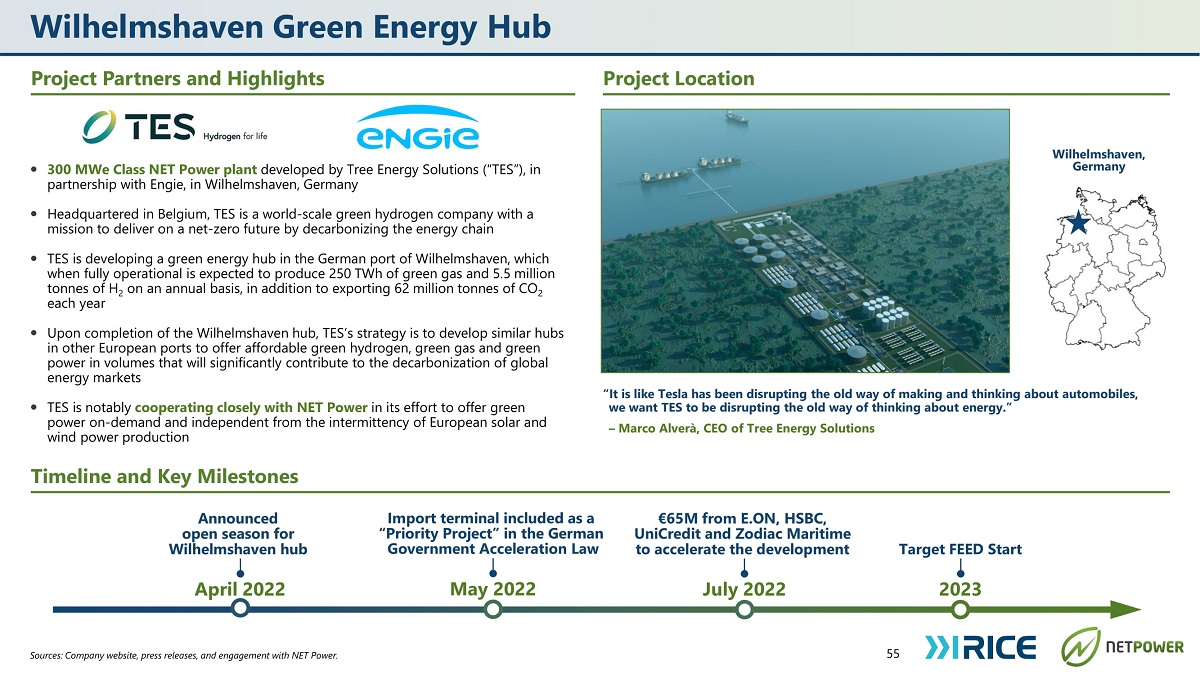
Wilhelmshaven Green Energy Hub Project Partners and Highlights ⚫ 300 MWe Class NET Power plant developed by Tree Energy Solutions (“TES”), in partnership with Engie, in Wilhelmshaven, Germany ⚫ Headquartered in Belgium, TES is a world - scale green hydrogen company with a mission to deliver on a net - zero future by decarbonizing the energy chain ⚫ TES is developing a green energy hub in the German port of Wilhelmshaven, which when fully operational is expected to produce 250 TWh of green gas and 5.5 million tonnes of H 2 on an annual basis, in addition to exporting 62 million tonnes of CO 2 each year ⚫ Upon completion of the Wilhelmshaven hub, TES’s strategy is to develop similar hubs in other European ports to offer affordable green hydrogen, green gas and green power in volumes that will significantly contribute to the decarbonization of global energy markets ⚫ TES is notably cooperating closely with NET Power in its effort to offer green power on - demand and independent from the intermittency of European solar and wind power production Timeline and Key Milestones Announced open season for Wilhelmshaven hub €65M from E.ON, HSBC, UniCredit and Zodiac Maritime to accelerate the development Target FEED Start Project Location “It is like Tesla has been disrupting the old way of making and thinking about automobiles, we want TES to be disrupting the old way of thinking about energy.” – Marco Alverà, CEO of Tree Energy Solutions 55 July 2022 April 2022 2023 Wilhelmshaven, Germany Sources: Company website, press releases, and engagement with NET Power. Import terminal included as a “Priority Project” in the German Government Acceleration Law May 2022
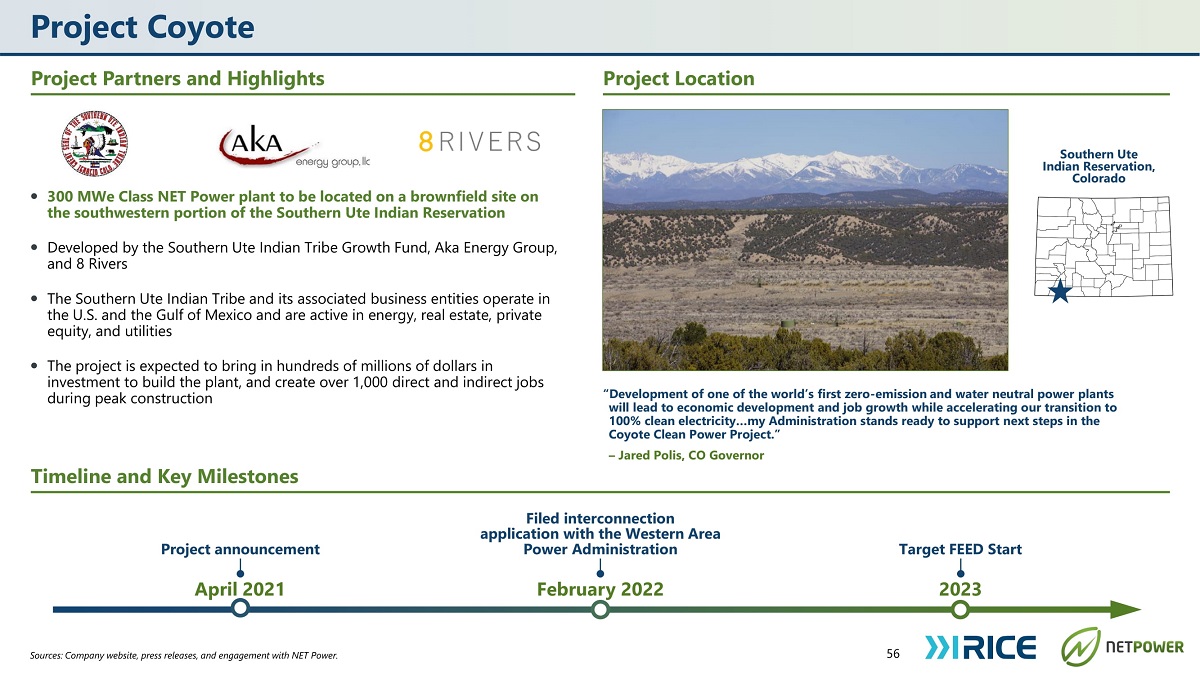
Project Coyote Project Partners and Highlights Project Location ⚫ 300 MWe Class NET Power plant to be located on a brownfield site on the southwestern portion of the Southern Ute Indian Reservation ⚫ Developed by the Southern Ute Indian Tribe Growth Fund, Aka Energy Group, and 8 Rivers ⚫ The Southern Ute Indian Tribe and its associated business entities operate in the U.S. and the Gulf of Mexico and are active in energy, real estate, private equity, and utilities ⚫ The project is expected to bring in hundreds of millions of dollars in investment to build the plant, and create over 1,000 direct and indirect jobs during peak construction Timeline and Key Milestones “Development of one of the world’s first zero - emission and water neutral power plants will lead to economic development and job growth while accelerating our transition to 100% clean electricity…my Administration stands ready to support next steps in the Coyote Clean Power Project.” – Jared Polis, CO Governor 56 Southern Ute Indian Reservation, Colorado Project announcement Filed interconnection application with the Western Area Power Administration Target FEED Start February 2022 April 2021 2023 Sources: Company website, press releases, and engagement with NET Power.

Project Broadwing Sources: Company website, press releases, and engagement with NET Power. Project Partners and Highlights Project Location ⚫ 300 MWe Class NET Power plant to be located adjacent to Archer Daniels Midland’s processing complex in Decatur, IL ⚫ Leverages an existing, on - site Class VI carbon storage well ⚫ Plant is part of the Broadwing Clean Energy Complex, which would represent $500MM+ of investment into Central Illinois ⚫ Development of the Complex is expected to create over 1,000 direct and indirect jobs during peak project construction Timeline and Key Milestones “Carbon - free power and industrial plants will be essential to achieving society's net - zero ambitions and providing the scale to enable the transition to a clean energy future. We see an unprecedented market opportunity for high - impact clean technologies and projects to globally advance net - zero carbon emissions.…” - Alfredo Mattera, Co - Chief Investment Officer and Founding Partner of Warwick Capital Partners 57 D eca tu r, Illinois Filed MISO Interconnection Application Project Announcement Target FEED Start April 2021 June 2020 2023
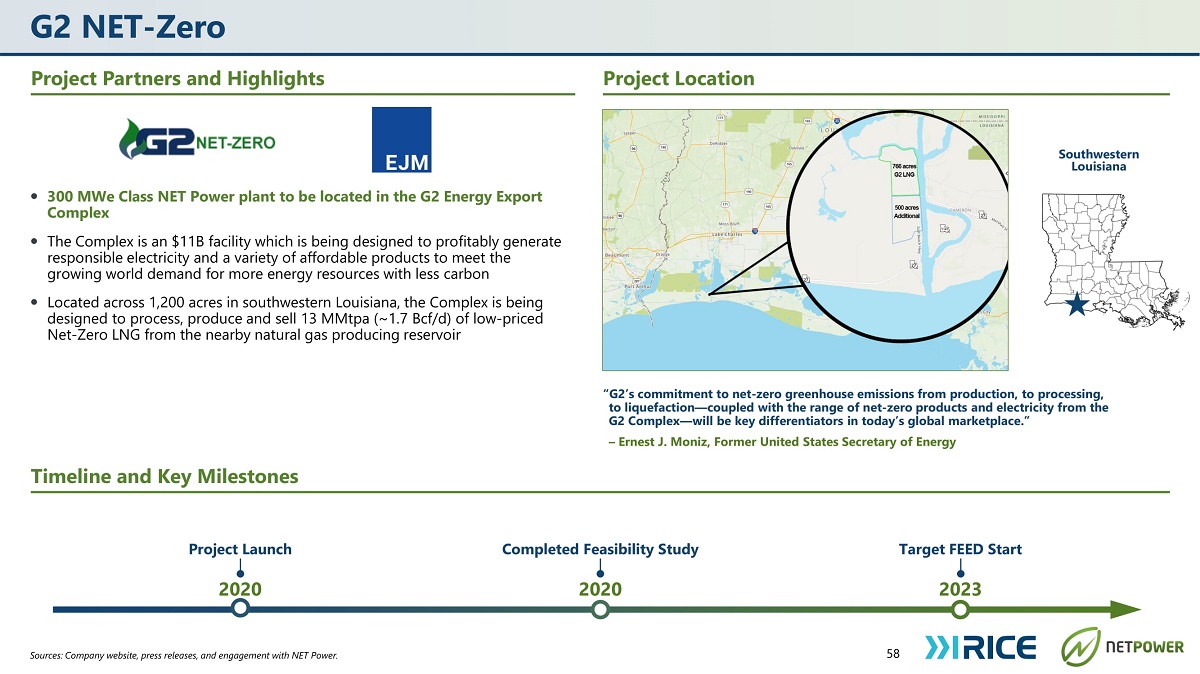
G2 NET - Zero Sources: Company website, press releases, and engagement with NET Power. Project Partners and Highlights Project Location ⚫ 300 MWe Class NET Power plant to be located in the G2 Energy Export Complex ⚫ The Complex is an $11B facility which is being designed to profitably generate responsible electricity and a variety of affordable products to meet the growing world demand for more energy resources with less carbon ⚫ Located across 1 , 200 acres in southwestern Louisiana, the Complex is being designed to process, produce and sell 13 MMtpa (~ 1 . 7 Bcf/d) of low - priced Net - Zero LNG from the nearby natural gas producing reservoir Timeline and Key Milestones “G2’s commitment to net - zero greenhouse emissions from production, to processing, to liquefaction — coupled with the range of net - zero products and electricity from the G2 Complex — will be key differentiators in today’s global marketplace.” – Ernest J. Moniz, Former United States Secretary of Energy 58 Southwestern Louisiana Project Launch Completed Feasibility Study Target FEED Start 2020 2020 2023
Risk Factors (1/3) Risks Related to Our Financial Position and Need for Additional Capital • We have incurred significant losses since inception and we anticipate that we will continue to incur losses in the future, and we may not be able to achieve or maintain profitability. • We may be unable to manage our future growth effectively, which could make it difficult to execute our business strategy. • Our ability to utilize our net operating loss and tax credit carryforwards to offset future taxable income may be subject to certain limitations. • There is doubt about our ability to continue as a going concern, and we may require additional future funding to continue as a going concern if the transactions contemplated herein are not completed. If we are unable to obtain sufficient funding on a timely basis and on acceptable terms and continue as a going concern, we may be required to significantly curtail, delay or discontinue one or more of our research or development programs or the commercialization of any product candidates or to otherwise reduce or discontinue our operations. In general, we may be unable to expand our operations or otherwise capitalize on business opportunities, and defend against and prosecute litigation necessary to commercialize our product candidates as desired, which could materially affect our business, financial condition and results of operations. If we are ultimately unable to continue as a going concern, we may have to take actions such as selling assets, restructuring, or seeking bankruptcy protection, and our shareholders may lose all or a part of their investment. • Our business plan of developing our Serial Number 1 power plant technology is capital - intensive, and we may not be able to raise additional capital on attractive terms, if at all, which could be dilutive to shareholders. If we require additional capital and cannot raise additional capital when needed or on attractive terms, our operations and prospects could be materially and adversely affected. Risks Related to Our Business and Our Industry • We face significant barriers in our attempts to deploy our technology and may not be able to successfully develop our technology. If we cannot successfully overcome those barriers, it could adversely impact our business and operations. • The technology we are developing will rely on complex machinery for its operations and deployment involves a significant degree of risk and uncertainty in terms of operational performance and costs. If there are any delays in the development and manufacturing of turboexpanders, heat exchangers and other implementing technology by our partners or third party suppliers it may adversely impact our business and financial condition. • We, our licensees, or our partners may not be able to establish supply relationships for necessary components or may be required to pay costs for components that are higher than anticipated, which could delay the deployment of our technology and negatively impact our business. • Our deployment plans rely on the development and supply of turbo machinery and process equipment by BH pursuant to a joint development arrangement. BH or ourselves may not be able to commercialize technology developed under their joint development relationship. If BH fails to commercialize such equipment, or such equipment fails to perform as expected, our ability to develop, market, and license our technology could be harmed. • Our commercialization strategy relies heavily on our relationship with BH, OXY and other strategic investors and partners, who may have interests that diverge from ours and who may not be easily replaced if our relationships terminate, which could adversely impact our business and financial condition. • Our partners have not yet completed development of and finalized schedules for delivery of key process equipment to customers, and any setbacks we may experience during our first commercial delivery planned for 2026 and other demonstration and commercial missions could have material adverse effects on our business, financial condition and results of operation, and could harm our reputation. • Lack of availability or increased costs of component raw materials may affect manufacturing processes for plant equipment and increase our overall costs or those of our licensees. • Our processes are reliant on certain supply, including natural gas, and the profitability of our processes will be dependent on the price of such supply. The increased cost of natural gas and other raw materials, in isolation or relative to other energy sources, may adversely affect the potential profitability and cost effectiveness of our processes. • Manufacturing and transportation of key equipment may be dependent on open global supply chains. Supply chain issues could negatively impact deployment schedules. • Suppliers of key equipment to our customers may not be able to scale to the production levels necessary to meet the anticipated growth in demand for our technology, which could negatively impact our business and financial plan. • Failure to ensure cost competitiveness by effectively incorporating updates to the design, construction, and operations of the NET Power Process plants could reduce the marketability of the NET Power Process plant design and may negatively impact deployment schedules. • Manufacturing and construction issues not identified prior to design finalization, long - lead procurement, and/or module fabrication could potentially be realized during production, fabrication, or construction and may impact plant deployment cost and schedule, which could adversely impact our business. • Our La Porte, Texas facilities and operations could be damaged or adversely affected as a result of natural disasters and other catastrophic events, which would negatively impact our ability to develop key process equipment and technologies within our anticipated timeline and budget. • Our test facility has not overcome all power loads so as to provide net positive power delivery to the commercial grid during its operation. If initial commercial plants using the NET Power Process are unable to efficiently provide a net power output to the commercial grid, it will negatively impact our business. • We may encounter difficulty in attracting licensees prior to the deployment of an initial full scale commercial plant. If we cannot successfully overcome the barriers to deploying a first full - scale plant, our business will be negatively impacted and could fail. • We expect a consortium led by NET Power to undertake the first commercial plant deployment (referred to as “Serial Number 1”) to establish our technology. Such a deployment will require a significant capital expenditure and depending on availability of capital, including grants, could require a substantial capital investment from us and our partners. If we cannot establish a first commercial scale plant, our business could fail. • Our future growth and success depend on our ability to license to customers and their ability to secure suitable sites. We have not yet entered into a binding contract with a customer to license the NET Power Process, and we may not be able to do so. • We may not be able to accurately estimate the future demand for our technology, which could result in a variety of inefficiencies in our business and hinder our ability to generate revenue. If we fail to accurately predict market demand, we could incur additional costs or experience delays, adversely impacting our business and financial condition. • We are highly dependent on our senior management team, key employees and other highly skilled personnel, and if we are not successful in attracting or retaining highly qualified personnel, we may not be able to successfully implement our business strategy and our ability to compete may be harmed. • From time to time, we may be involved in legal proceedings and commercial, contractual or intellectual property disputes, which could have an adverse impact on our profitability and consolidated financial position. • We may become subject to product liability claims, which could harm our financial condition and liquidity. 59
Risk Factors (2/3) 60 • Despite implementing and maintaining industry standard security measures and controls, the website, systems, and data we maintain may be subject to intentional disruption, other security incidents, or alleged violations of laws, regulations, or other obligations relating to data handling that could result in liability and adversely impact our reputation and future sales. • Our insurance coverage may not be adequate to protect from all business risks, adversely impacting our business and financial condition. • COVID - 19 and any future widespread public health crisis could negatively affect various aspects of our business, make it more difficult for us to meet our obligations to our customers and result in reduced demand for our products and services. • Any financial or economic crisis, or perceived threat of such a crisis, including a significant decrease in consumer confidence, may materially and adversely affect our business, financial condition, and results of operations. • Our commercialization strategy relies heavily on our contractual relationship with BH. Pursuant to a joint development arrangement with BH, BH may terminate this arrangement in the event of a change of control. A change of control under this arrangement may occur in the future. Additionally, certain arrangements that we have with BH allow for the termination of the particular agreement by BH as a result of circumstances that are either solely or partially under the control of BH. We may not be able to replace this strategic partnership if our relationships terminate, which could adversely impact our business and financial condition. • We, and our licensees and partners, may be unable to adequately control the costs associated with the development and deployment of our technology. Risks Related to NET Power’s Market • The energy market continues to evolve, is highly competitive, and we may not be successful in competing in this industry or establishing and maintaining confidence in our long - term business prospects among current and future partners and customers. The development and adoption of competing technology could materially and adversely affect our ability to license our technology. • The market for power plants implementing the NET Power Process is not yet established and there is limited infrastructure to efficiently transport and store CO 2 . If the market for power plants implementing the NET Power Process does not achieve the growth potential we expect or grows more slowly than expected, it could materially and adversely affect our business. • The cost of electricity generated from NET Power Process may not be cost competitive with other electricity generation sources in some markets, which could materially and adversely affect our business. Risks Related to the Business Combination • In 2022, there has been a precipitous drop in the market values of growth - oriented companies like NET Power. In recent months, inflationary pressures, increases in interest rates and other adverse economic and market forces have contributed to these drops in market value. Such downward pressures may result in high redemptions by SPAC shareholders. If there are substantial redemptions, there will be a lower float of our common stock outstanding after the business combination, which may cause further volatility in the price of our securities after the business combination and adversely impact our ability to secure financing following the closing of the business combination. • As with most SPAC initial public offerings in recent years, RONI issued shares for $10.00 per share upon the closing of its initial public offering. As with other SPACs, the $10.00 per share price reflected each share having a one - time right to redeem such share for a pro rata portion of the proceeds held in the trust account equal to approximately $10.00 per share in connection with the closing of the business combination. Following closing of the business combination, the shares outstanding will no longer have any such redemption right and will be solely dependent upon the fundamental value of the combined company, which, like the securities of other companies formed through SPAC mergers in recent years, may be significantly less than $10.00 per share. Risks Related to Government Regulation • Our business relies on the deployment of power plants that are subject to a wide variety of extensive and evolving government laws and regulations, including environmental laws and regulations. Changes in and/or failure to comply with such laws and regulations could have a material adverse effect on our business. • Our customers must obtain regulatory approvals and permits before they construct power plants using our technology and approvals may be denied or delayed. • Unfavorable changes in laws, regulations, and policies in countries in which we seek to license our technology, or our, or our partners or project developers’, failures to secure timely government authorizations under laws and regulations, or our failure to comply with these laws and regulations could have a material adverse effect on our business, financial condition and results of operations. • Changes in laws and regulations and electric market rules and protocols regarding the requirements for interconnection to the electric transmission grid and the commercial operation of our customers’ power generation projects could affect the cost, timing and economic results of conducting our operations. • We, and our potential licensees, may encounter substantial delays in the design, manufacture, regulatory approval, and launch of power plants, which could prevent us and our licensees from commercializing and deploying our technology on a timely basis, if at all. • Our customers are subject to environmental, health and safety laws and regulations to include, if applicable, remediation matters which could adversely affect our business, results of operation and reputation. • We and our customers operate in a politically sensitive environment, and the public perception of fossil fuel derived energy can affect our customers and us. Our future growth and success are dependent upon consumers’ willingness to develop natural gas - fueled power generation facilities. • The demand for our business may be curtailed by government or prospective licensees failing to consider hydrocarbon - based power as “clean,” even when paired with energy transition technology such as carbon capture, use, storage and sequestration, thereby reducing our expected growth. • We are subject to increasing regulatory scrutiny and potential enforcement regarding the energy transition, to include deployment of low - emissions technology and claims we or our licensees may make regarding the same, which could adversely affect our business, reputation, and operations. • The ability to license and deploy natural gas power plants may be limited due to conflict, war, or other political disagreements between gas producing nations and potential customers, which may adversely impact our business plan. • We are, or will be, subject to anti - corruption, anti - bribery, anti - money laundering, financial and economic sanctions and similar laws, and non - compliance with such laws can subject us to administrative, civil and criminal fines and penalties, collateral consequences, remedial measures and legal expenses, all of which could adversely affect our business, results of operations, financial condition and reputation. • Changes in tax laws, incentives, or regulations may increase tax uncertainty and adversely affect results of our operations and our effective tax rate. • Any potential changes or reductions in available government incentives promoting greenhouse gas emissions projects, such as the Inflation Reduction Act’s financial assistance program funding installation of zero - emission technology, may adversely affect our ability to grow our business.
Risk Factors (3/3) 61 Risks Related to Intellectual Property • We are developing NET Power - owned intellectual property, but we rely heavily on the intellectual property we have in - licensed which is core to the NET Power Process. The ability to protect these patents, patent applications and other proprietary rights may be challenged or may be faced with our inability or failure to obtain, maintain, protect, defend and enforce, exposing us to possible material adverse impacts on our business, competitive position and operating results. • We may lose our rights to some or all of the core intellectual property that is in - licensed by way of either the licensor not paying renewal fees or maintenance fees, or third parties challenging the validity of the intellectual property, thereby resulting in competitors easily entering into the same market and decreasing the revenue that we receive from our customers, and may adversely affect our ability to develop, market and license our technology. • We, and our partners, licensees, and critical equipment suppliers may need to defend ourselves against intellectual property infringement claims which may negatively impact market demand for our process licenses. Further, defending against intellectual property claims can be time - consuming, incur substantial financial costs, and divert our resources away from our business efforts, regardless of the outcome of these claims. • Third parties may successfully challenge or invalidate our rights or ability to use in - licensed intellectual property that is core to the NET Power Process. • The unauthorized infringement, misappropriation, dilution or other violation of our intellectual property rights could diminish the value of our services, brands or goodwill and cause a decline in our revenue. • Our patent applications may not result in issued patents and our patent rights may be contested, circumvented, invalidated or limited in scope, any of which could have a material adverse effect on our ability to prevent others from interfering with commercialization of our technology. • We maintain certain technology as trade secret and others could independently develop competing or similar technologies, allowing others to develop plants without our license if our other intellectual property rights are insufficient to prevent such unlicensed development and deployment of plants. • A number of foreign countries do not protect intellectual property rights to the same extent as the United States. Therefore, our intellectual property rights may not be as strong or as easily enforced outside of the United States and efforts to protect against the infringement, misappropriation or unauthorized use of our intellectual property rights, technology and other proprietary rights may be difficult and costly outside of the United States. Furthermore, legal standards relating to the validity, enforceability and scope of protection of intellectual property rights are uncertain and any changes in, or unexpected interpretations of, intellectual property laws may compromise our ability to enforce our patent rights, trade secrets and other intellectual property rights. • Despite conducting competitive analyses, we, or our partners or licensees, may not identify relevant third - party patents or may incorrectly interpret the relevance, scope or expiration of a third - party patent, which may adversely affect our ability to develop, market and license our technology. • We may be subject to claims of ownership and other rights to our patents and other intellectual property by third parties, which may adversely affect our ability to develop, market and license our technology. • The information technology systems and data that we maintain may be subject to intentional or inadvertent disruption, other security incidents, or alleged violations of laws, regulations or other obligations relating to data handling that could result in regulatory investigations or actions, litigation, fines and penalties, disruptions of our business operations, reputational harm, loss of revenue or profits, loss of customers or sales and other adverse business consequences.