EX-99.1
Published on September 10, 2024

Investor Presentation September 2024
2 Cautionary Note Regarding Forward-Looking Statements and Projections. Certain statements in this presentation may constitute “forward-looking statements” within the meaning of Section 27A of the Securities Act of 1933, Section 21E of the Securities Exchange Act of 1934 and the Private Securities Litigation Reform Act of 1995, each as amended. Forward-looking statements provide current expectations of future events and include any statement that does not directly relate to any historical or current fact. Words such as “anticipates,” “believes,” “expects,” “intends,” “plans,” “projects,” or other similar expressions may identify such forward-looking statements. Forward-looking statements may relate to the development of NET Power’s technology, the anticipated demand for NET Power’s technology and the markets in which NET Power operates, the timing of the deployment of plant deliveries, and NET Power’s business strategies, capital requirements, potential growth opportunities and expectations for future performance (financial or otherwise). Forward-looking statements are based on current expectations, estimates, projections, targets, opinions and/or beliefs of the Company, and such statements involve known and unknown risks, uncertainties and other factors. Actual results may differ materially from those discussed in forward-looking statements as a result of factors, risks and uncertainties over which NET Power has no control. These factors, risks and uncertainties include, but are not limited to, the following: (i) NET Power’s history of significant losses; (ii) NET Power’s ability to manage future growth effectively; (iii) NET Power’s ability to utilize its net operating loss and tax credit carryforwards effectively; (iv) the capital-intensive nature of NET Power’s business model, which will require NET Power and/or its subsidiaries to raise additional capital in the future; (v) barriers NET Power may face in its attempts to deploy and commercialize its technology; (vi) the complexity of the machinery NET Power relies on for its operations and development; (vii) potential changes and/or delays in site selection and construction that result from regulatory, logistical, and financing challenges; (viii) NET Power’s ability to establish and maintain supply relationships; (ix) risks related to NET Power’s joint development arrangements with Baker Hughes and reliance on Baker Hughes to commercialize and deploy its technology; (x) risks related to NET Power’s other strategic investors and partners; (xi) NET Power’s ability to successfully commercialize its operations; (xii) the availability and cost of raw materials; (xiii) the ability of NET Power’s supply base to scale to meet NET Power’s anticipated growth; (xiv) risks related to NET Power’s ability to meet its projections; (xv) NET Power’s ability to expand internationally; (xvi) NET Power’s ability to update the design, construction and operations of its NET Power process; (xvii) the impact of potential delays in discovering manufacturing and construction issues; (xviii) the possibility of damage to NET Power’s Texas facilities as a result of natural disasters; (xix) the ability of commercial plants using the NET Power process to efficiently provide net power output; (xx) NET Power’s ability to obtain and retain licenses; (xxi) NET Power’s ability to establish an initial commercial scale plant; (xxii) NET Power’s ability to license to large customers; (xxiii) NET Power’s ability to accurately estimate future commercial demand; (xxiv) NET Power’s ability to adapt to the rapidly evolving and competitive natural and renewable power industry; (xxv) NET Power’s ability to comply with all applicable laws and regulations; (xxvi) the impact of public perception of fossil fuel derived energy on NET Power’s business; (xxvii) any political or other disruptions in gas producing nations; (xxviii) NET Power’s ability to protect its intellectual property and the intellectual property it licenses; (xxix ) risks relating to data privacy and cybersecurity, including the potential for cyberattacks or security incidents that could disrupt our or our service providers’ operations; (xxx) the Company’s ability to meet stock exchange listing standards following the Business Combination; (xxxi) potential litigation that may be instituted against the Company; and (xxxii) other risks and uncertainties indicated in NET Power's Annual Report on Form 10-K for the year ended December 31, 2023, including those under “Risk Factors” therein, its subsequent annual reports on Form 10-K and quarterly reports on Form 10-Q, and in its other filings made with the SEC from time to time, which are available via the SEC’s website at www.sec.gov. Forward-looking statements speak only as of the date they are made. Readers are cautioned not to put undue reliance on forward-looking statements, and NET Power assumes no obligation and does not intend to update or revise these forward-looking statements, whether as a result of new information, future events, or otherwise. NET Power does not give any assurance that it will achieve its expectations. Important Notice
3power Presentation Agenda Introduction & Executive Summary Technology Development Commercial Development Financial Updates Q&A / Closing Remarks
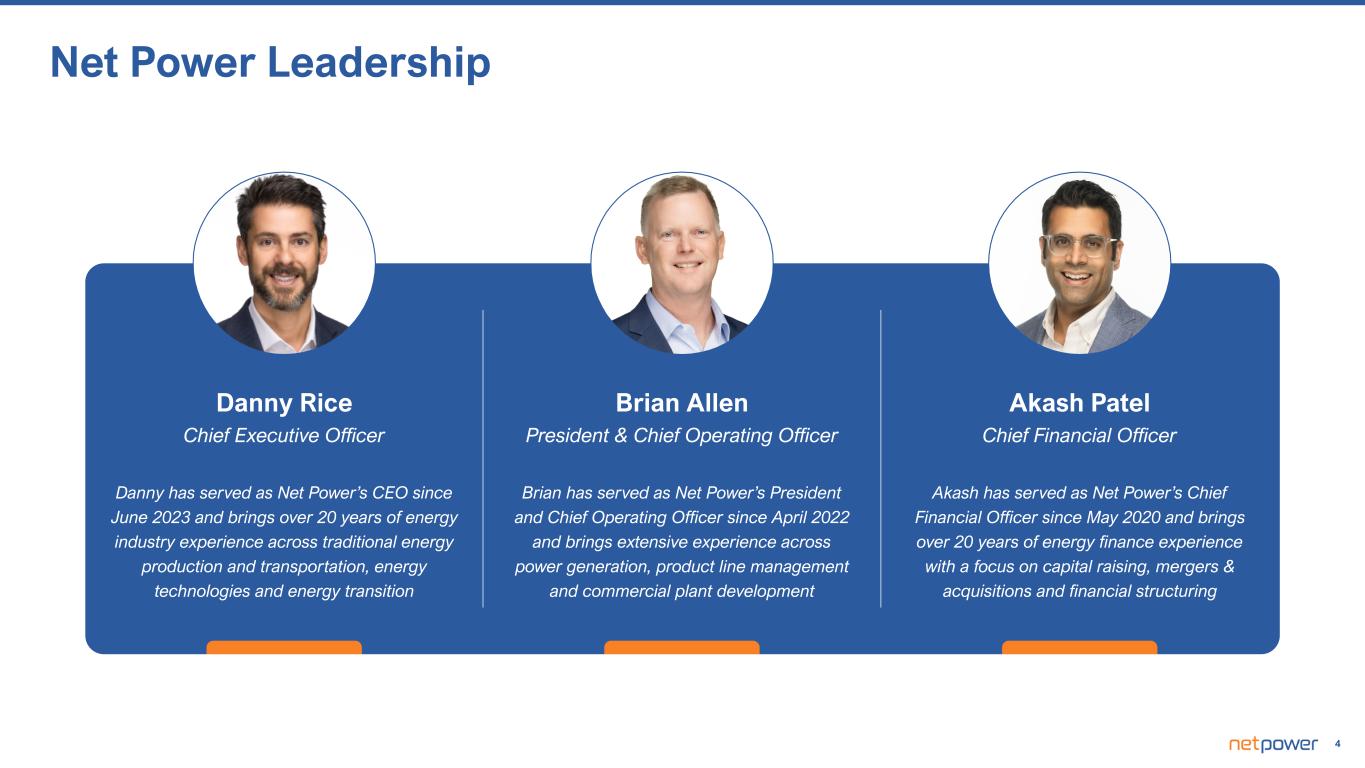
4 Net Power Leadership Danny has served as Net Power’s CEO since June 2023 and brings over 20 years of energy industry experience across traditional energy production and transportation, energy technologies and energy transition Danny Rice Chief Executive Officer Brian Allen President & Chief Operating Officer Akash Patel Chief Financial Officer Brian has served as Net Power’s President and Chief Operating Officer since April 2022 and brings extensive experience across power generation, product line management and commercial plant development Akash has served as Net Power’s Chief Financial Officer since May 2020 and brings over 20 years of energy finance experience with a focus on capital raising, mergers & acquisitions and financial structuring
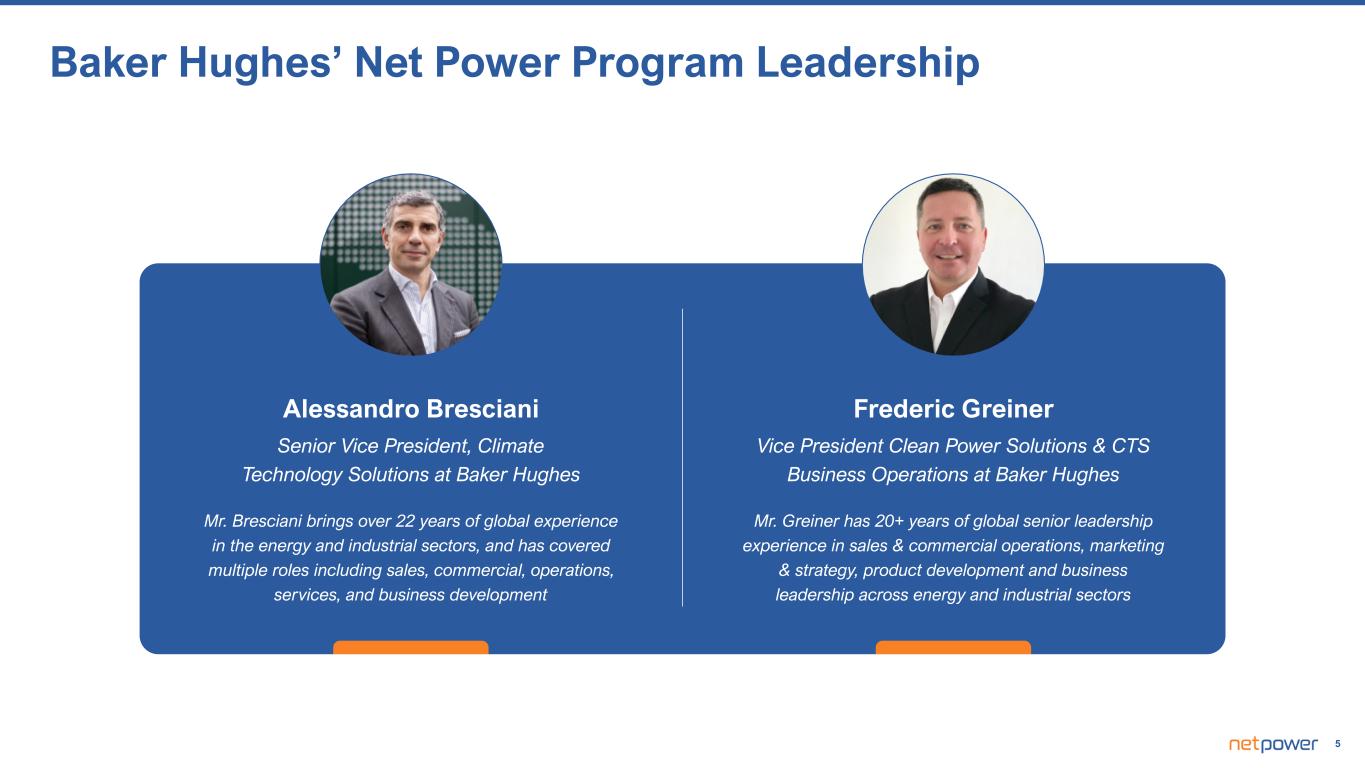
5 Baker Hughes’ Net Power Program Leadership Frederic Greiner Vice President Clean Power Solutions & CTS Business Operations at Baker Hughes Alessandro Bresciani Senior Vice President, Climate Technology Solutions at Baker Hughes Mr. Bresciani brings over 22 years of global experience in the energy and industrial sectors, and has covered multiple roles including sales, commercial, operations, services, and business development Mr. Greiner has 20+ years of global senior leadership experience in sales & commercial operations, marketing & strategy, product development and business leadership across energy and industrial sectors
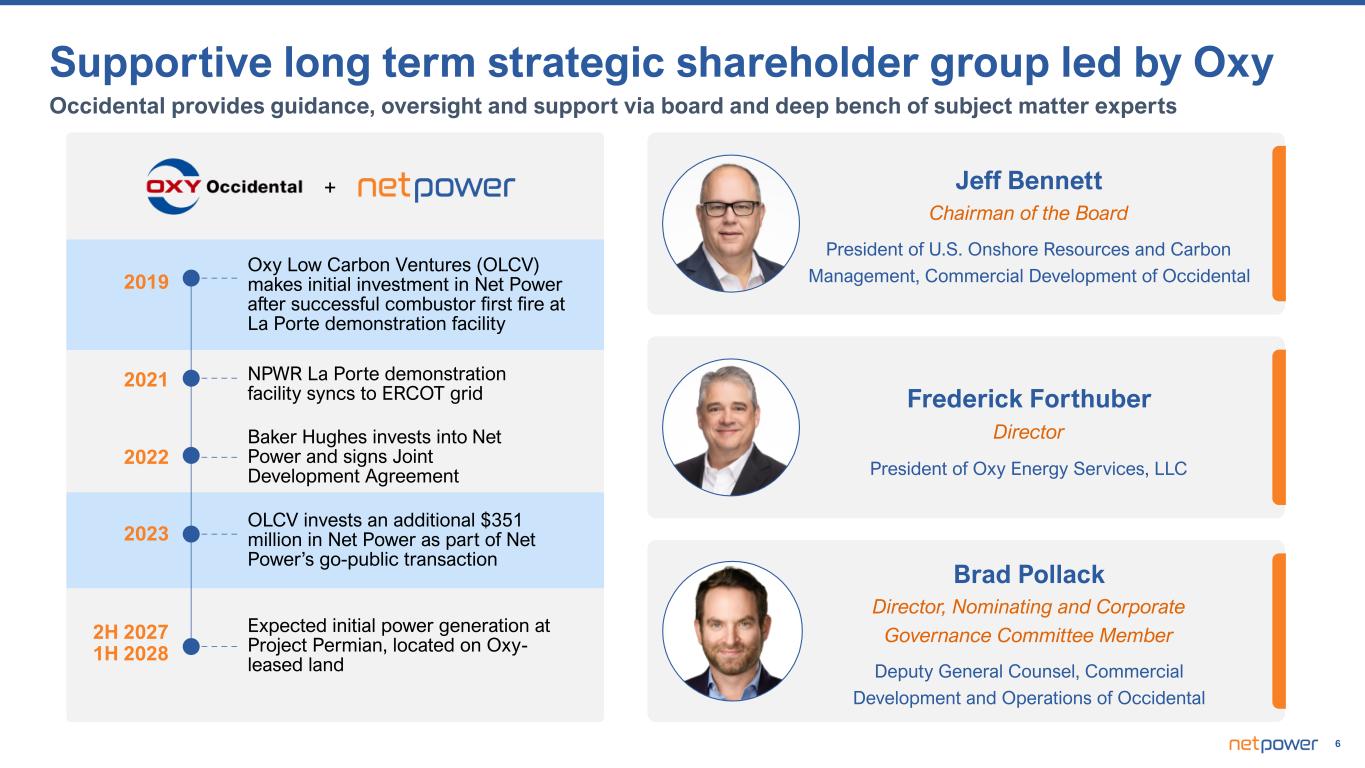
6 President of U.S. Onshore Resources and Carbon Management, Commercial Development of Occidental Jeff Bennett Chairman of the Board President of Oxy Energy Services, LLC Frederick Forthuber Director Deputy General Counsel, Commercial Development and Operations of Occidental Brad Pollack Director, Nominating and Corporate Governance Committee Member Supportive long term strategic shareholder group led by Oxy Occidental provides guidance, oversight and support via board and deep bench of subject matter experts Oxy Low Carbon Ventures (OLCV) makes initial investment in Net Power after successful combustor first fire at La Porte demonstration facility 2019 2023 OLCV invests an additional $351 million in Net Power as part of Net Power’s go-public transaction Expected initial power generation at Project Permian, located on Oxy- leased land NPWR La Porte demonstration facility syncs to ERCOT grid 2H 2027 1H 2028 + 2021 Baker Hughes invests into Net Power and signs Joint Development Agreement 2022

7 Executive Summary
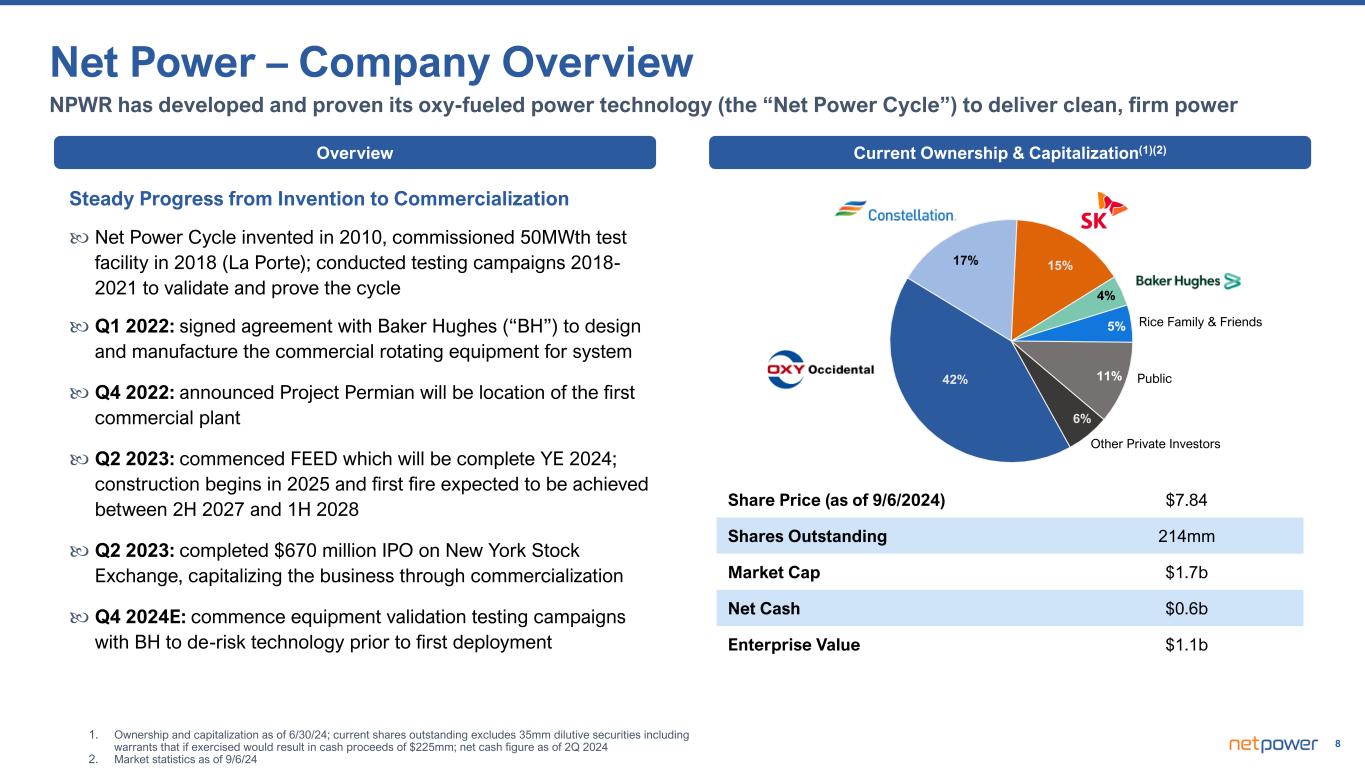
8 Net Power – Company Overview Steady Progress from Invention to Commercialization Net Power Cycle invented in 2010, commissioned 50MWth test facility in 2018 (La Porte); conducted testing campaigns 2018- 2021 to validate and prove the cycle Q1 2022: signed agreement with Baker Hughes (“BH”) to design and manufacture the commercial rotating equipment for system Q4 2022: announced Project Permian will be location of the first commercial plant Q2 2023: commenced FEED which will be complete YE 2024; construction begins in 2025 and first fire expected to be achieved between 2H 2027 and 1H 2028 Q2 2023: completed $670 million IPO on New York Stock Exchange, capitalizing the business through commercialization Q4 2024E: commence equipment validation testing campaigns with BH to de-risk technology prior to first deployment Current Ownership & Capitalization(1)(2)Overview 42% 17% 15% 4% 5% 11% 6% Rice Family & Friends Public Other Private Investors Share Price (as of 9/6/2024) $7.84 Shares Outstanding 214mm Market Cap $1.7b Net Cash $0.6b Enterprise Value $1.1b NPWR has developed and proven its oxy-fueled power technology (the “Net Power Cycle”) to deliver clean, firm power 1. Ownership and capitalization as of 6/30/24; current shares outstanding excludes 35mm dilutive securities including warrants that if exercised would result in cash proceeds of $225mm; net cash figure as of 2Q 2024 2. Market statistics as of 9/6/24
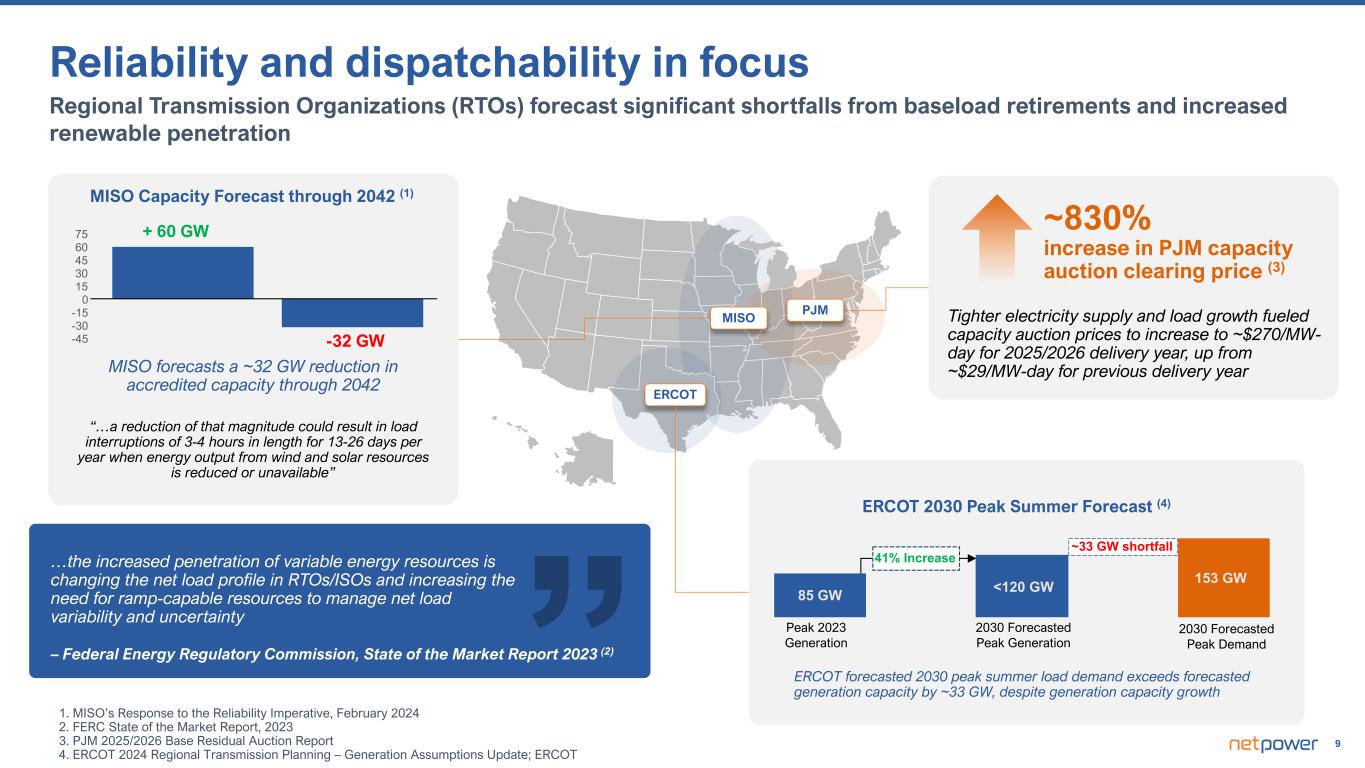
9 0 15 30 45 60 75 -15 -30 -45 Reliability and dispatchability in focus Regional Transmission Organizations (RTOs) forecast significant shortfalls from baseload retirements and increased renewable penetration ~830% increase in PJM capacity auction clearing price (3) Tighter electricity supply and load growth fueled capacity auction prices to increase to ~$270/MW- day for 2025/2026 delivery year, up from ~$29/MW-day for previous delivery year ERCOT forecasted 2030 peak summer load demand exceeds forecasted generation capacity by ~33 GW, despite generation capacity growth MISO PJM ERCOT MISO Capacity Forecast through 2042 (1) MISO forecasts a ~32 GW reduction in accredited capacity through 2042 “…a reduction of that magnitude could result in load interruptions of 3-4 hours in length for 13-26 days per year when energy output from wind and solar resources is reduced or unavailable” -32 GW + 60 GW – Federal Energy Regulatory Commission, State of the Market Report 2023 (2) …the increased penetration of variable energy resources is changing the net load profile in RTOs/ISOs and increasing the need for ramp-capable resources to manage net load variability and uncertainty ~33 GW shortfall <120 GW 153 GW ERCOT 2030 Peak Summer Forecast (4) 85 GW 41% Increase Peak 2023 Generation 2030 Forecasted Peak Generation 2030 Forecasted Peak Demand 1. MISO’s Response to the Reliability Imperative, February 2024 2. FERC State of the Market Report, 2023 3. PJM 2025/2026 Base Residual Auction Report 4. ERCOT 2024 Regional Transmission Planning – Generation Assumptions Update; ERCOT
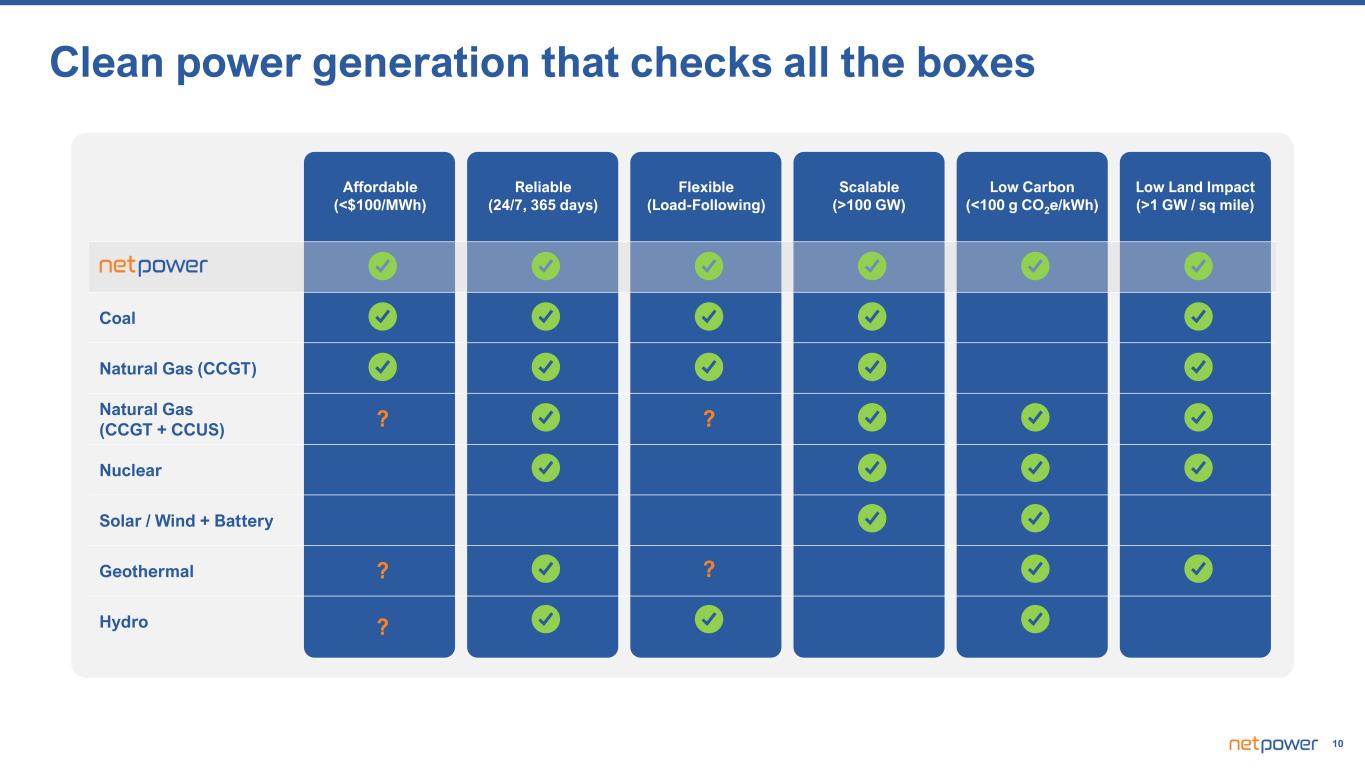
10 Clean power generation that checks all the boxes Affordable (<$100/MWh) Reliable (24/7, 365 days) Flexible (Load-Following) Scalable (>100 GW) Low Carbon (<100 g CO2e/kWh) Low Land Impact (>1 GW / sq mile) Coal Natural Gas (CCGT) Natural Gas (CCGT + CCUS) Nuclear Solar / Wind + Battery Geothermal Hydro ? ? ? ? ?
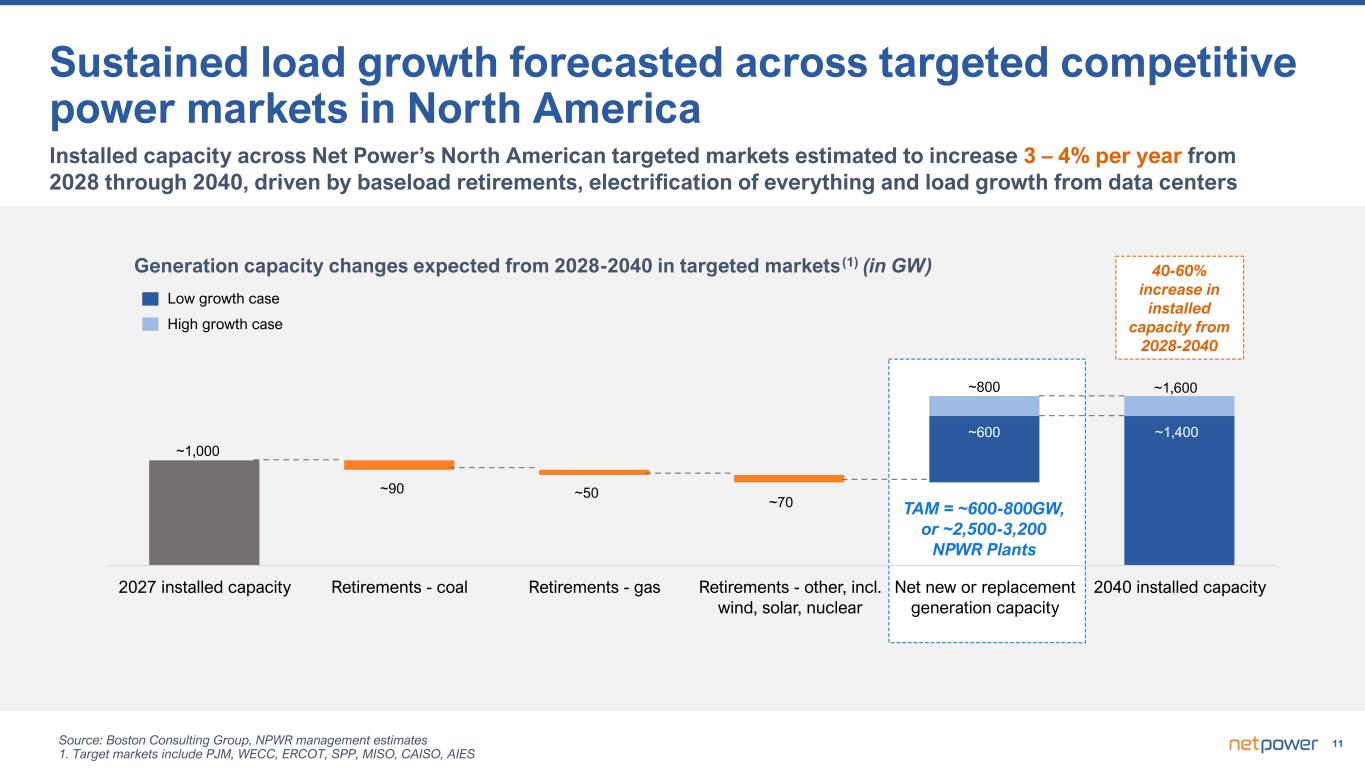
11 2027 installed capacity Retirements - coal Retirements - gas Retirements - other, incl. wind, solar, nuclear Net new or replacement generation capacity 2040 installed capacity Source: Boston Consulting Group, NPWR management estimates 1. Target markets include PJM, WECC, ERCOT, SPP, MISO, CAISO, AIES Installed capacity across Net Power’s North American targeted markets estimated to increase 3 – 4% per year from 2028 through 2040, driven by baseload retirements, electrification of everything and load growth from data centers ~1,000 ~1,400 TAM = ~600-800GW, or ~2,500-3,200 NPWR Plants Generation capacity changes expected from 2028-2040 in targeted markets (1) (in GW) ~90 ~50 ~70 ~1,600 ~600 ~800 Low growth case High growth case Sustained load growth forecasted across targeted competitive power markets in North America 40-60% increase in installed capacity from 2028-2040
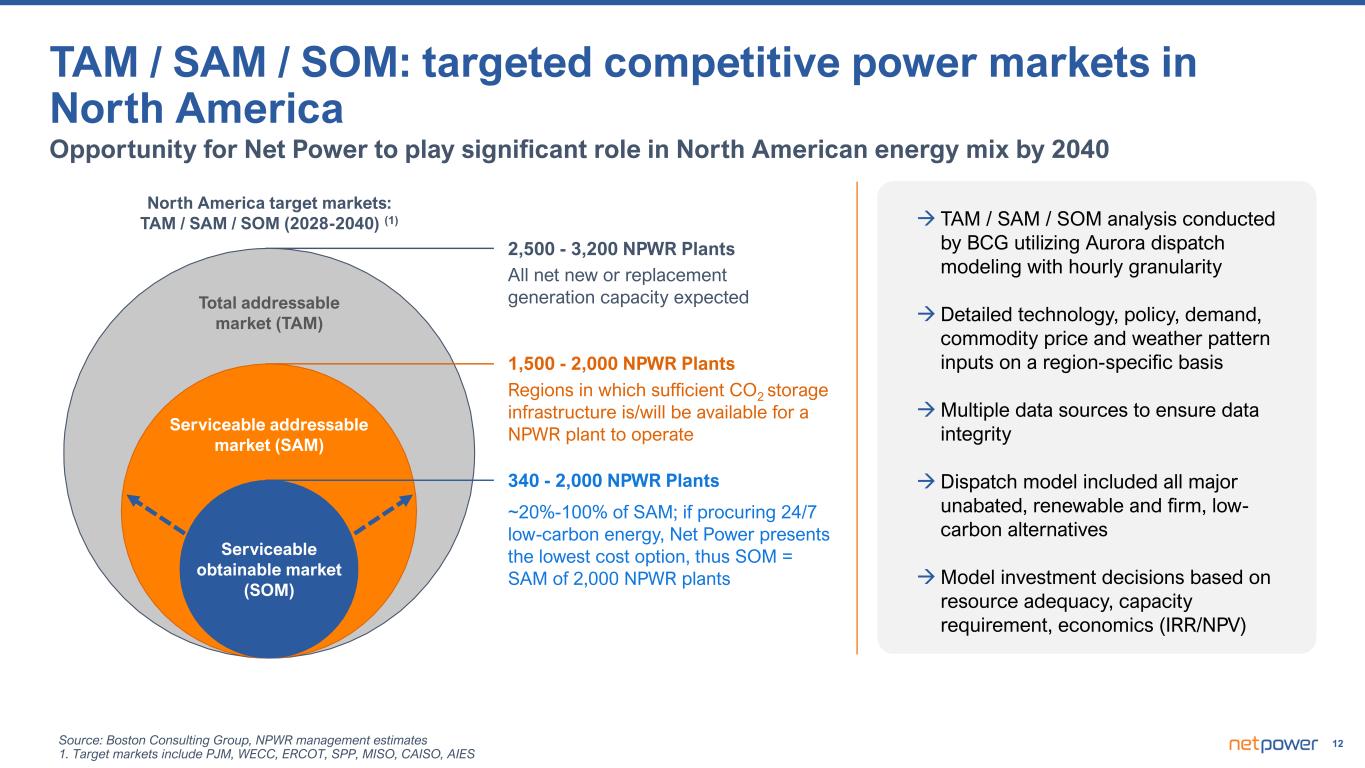
12 Total addressable market (TAM) Serviceable addressable market (SAM) Serviceable obtainable market (SOM) All net new or replacement generation capacity expected Regions in which sufficient CO2 storage infrastructure is/will be available for a NPWR plant to operate ~20%-100% of SAM; if procuring 24/7 low-carbon energy, Net Power presents the lowest cost option, thus SOM = SAM of 2,000 NPWR plants 2,500 - 3,200 NPWR Plants TAM / SAM / SOM analysis conducted by BCG utilizing Aurora dispatch modeling with hourly granularity Detailed technology, policy, demand, commodity price and weather pattern inputs on a region-specific basis Multiple data sources to ensure data integrity Dispatch model included all major unabated, renewable and firm, low- carbon alternatives Model investment decisions based on resource adequacy, capacity requirement, economics (IRR/NPV) 1,500 - 2,000 NPWR Plants 340 - 2,000 NPWR Plants Opportunity for Net Power to play significant role in North American energy mix by 2040 TAM / SAM / SOM: targeted competitive power markets in North America North America target markets: TAM / SAM / SOM (2028-2040) (1) Source: Boston Consulting Group, NPWR management estimates 1. Target markets include PJM, WECC, ERCOT, SPP, MISO, CAISO, AIES
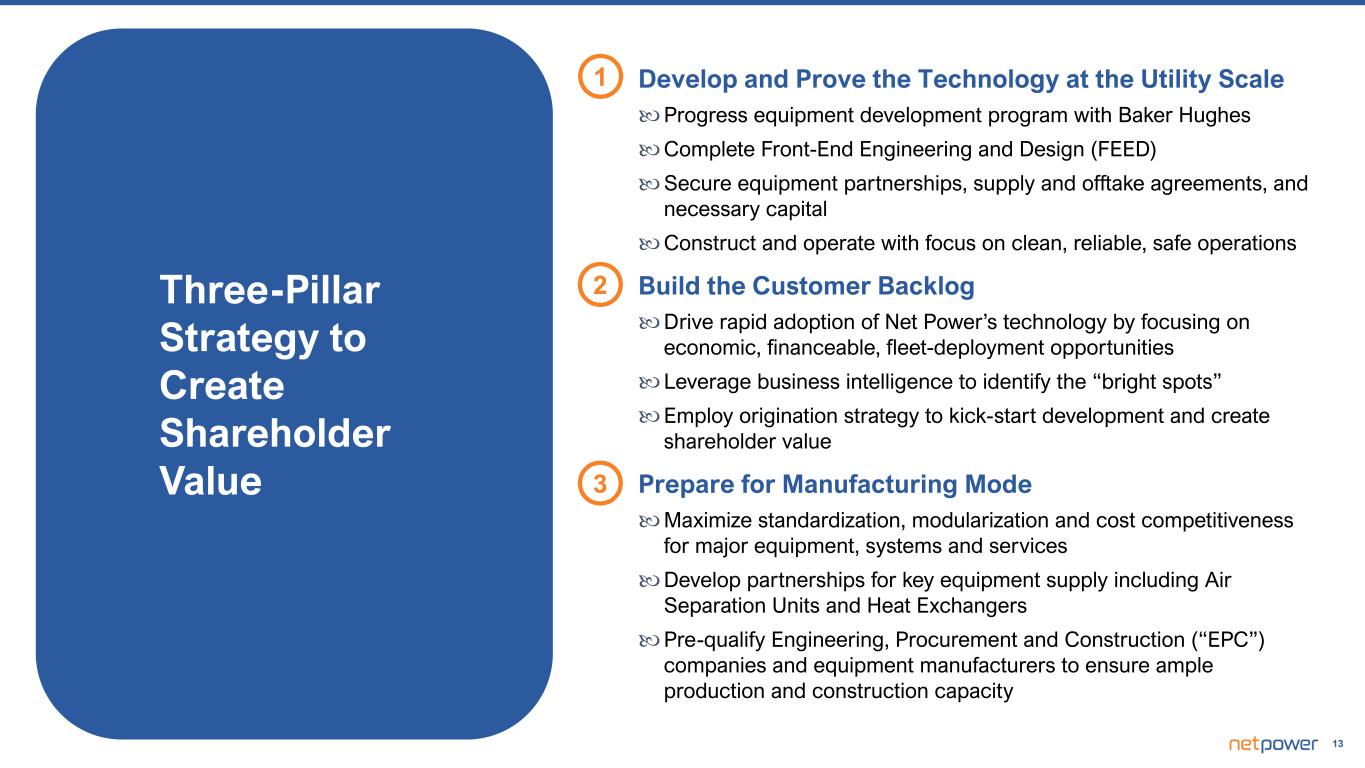
13 Develop and Prove the Technology at the Utility Scale Progress equipment development program with Baker Hughes Complete Front-End Engineering and Design (FEED) Secure equipment partnerships, supply and offtake agreements, and necessary capital Construct and operate with focus on clean, reliable, safe operations Build the Customer Backlog Drive rapid adoption of Net Power’s technology by focusing on economic, financeable, fleet-deployment opportunities Leverage business intelligence to identify the “bright spots” Employ origination strategy to kick-start development and create shareholder value Prepare for Manufacturing Mode Maximize standardization, modularization and cost competitiveness for major equipment, systems and services Develop partnerships for key equipment supply including Air Separation Units and Heat Exchangers Pre-qualify Engineering, Procurement and Construction (“EPC”) companies and equipment manufacturers to ensure ample production and construction capacity 2 1 3 Three-Pillar Strategy to Create Shareholder Value

14 Technology Development
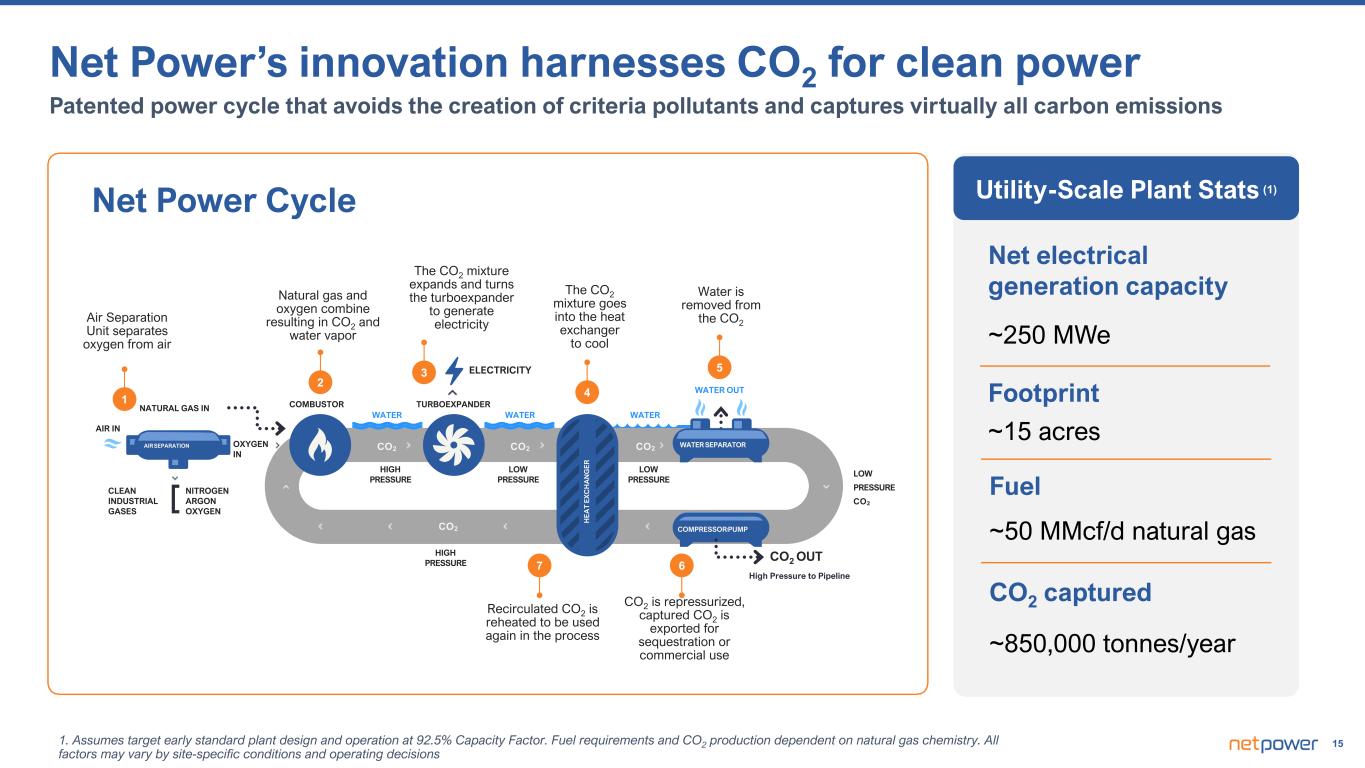
15 Net Power’s innovation harnesses CO2 for clean power LOW PRESSURE CO2 AIR SEPARATION COMPRESSOR/PUMP H E A T E X C H A N G E R WATER SEPARATOR WATERWATERWATER ELECTRICITY TURBOEXPANDERCOMBUSTORNATURAL GAS IN OXYGEN IN AIR IN CLEAN INDUSTRIAL GASES NITROGEN ARGON OXYGEN CO2 OUT High Pressure to Pipeline WATER OUT CO2 HIGH PRESSURE CO2 LOW PRESSURE CO2 LOW PRESSURE CO2 HIGH PRESSURE Air Separation Unit separates oxygen from air Natural gas and oxygen combine resulting in CO2 and water vapor The CO2 mixture expands and turns the turboexpander to generate electricity The CO2 mixture goes into the heat exchanger to cool Water is removed from the CO2 CO2 is repressurized, captured CO2 is exported for sequestration or commercial use Recirculated CO2 is reheated to be used again in the process 1 2 3 4 5 67 Patented power cycle that avoids the creation of criteria pollutants and captures virtually all carbon emissions Utility-Scale Plant Stats (1) Net electrical generation capacity ~250 MWe Footprint ~15 acres Fuel ~50 MMcf/d natural gas CO2 captured ~850,000 tonnes/year Net Power Cycle 1. Assumes target early standard plant design and operation at 92.5% Capacity Factor. Fuel requirements and CO2 production dependent on natural gas chemistry. All factors may vary by site-specific conditions and operating decisions
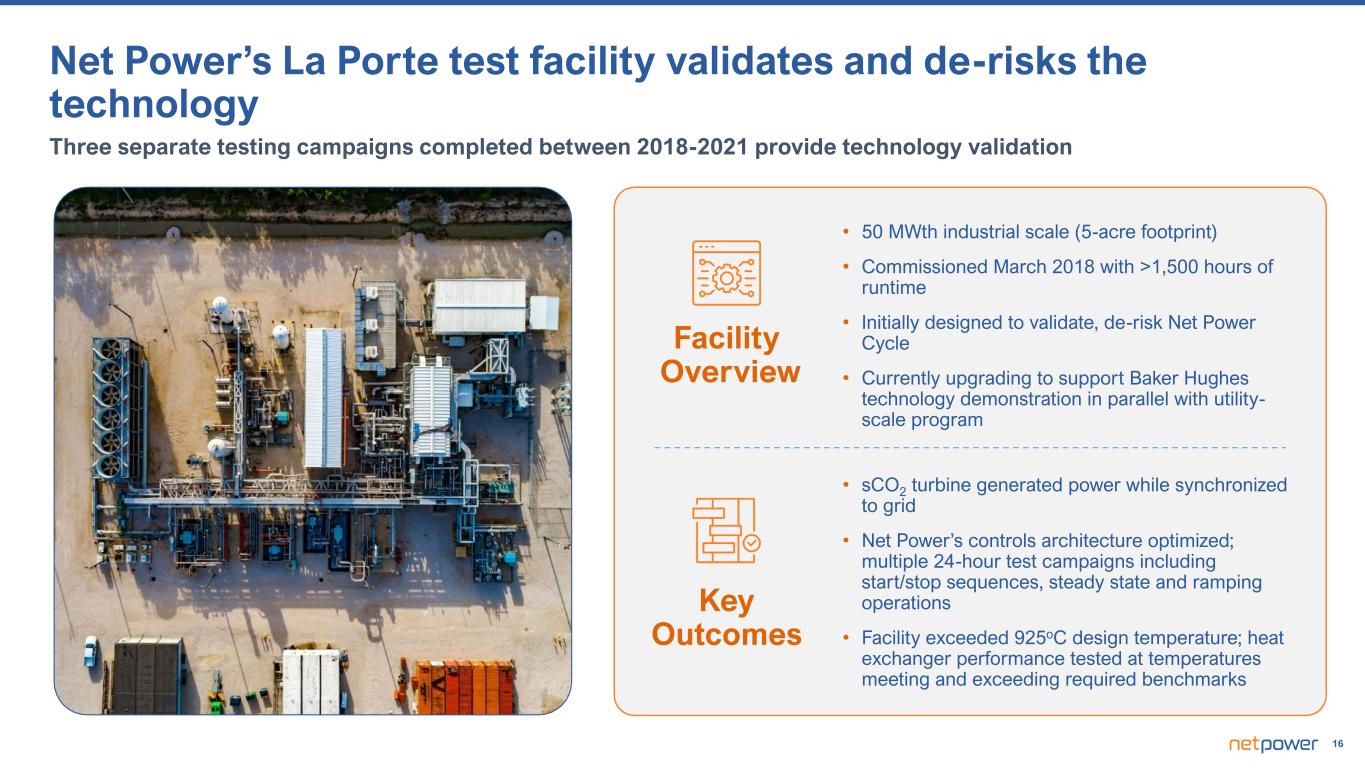
16 • 50 MWth industrial scale (5-acre footprint) • Commissioned March 2018 with >1,500 hours of runtime • Initially designed to validate, de-risk Net Power Cycle • Currently upgrading to support Baker Hughes technology demonstration in parallel with utility- scale program Facility Overview • sCO2 turbine generated power while synchronized to grid • Net Power’s controls architecture optimized; multiple 24-hour test campaigns including start/stop sequences, steady state and ramping operations • Facility exceeded 925oC design temperature; heat exchanger performance tested at temperatures meeting and exceeding required benchmarks Net Power’s La Porte test facility validates and de-risks the technology Three separate testing campaigns completed between 2018-2021 provide technology validation Key Outcomes

Copyright 2024 Baker Hughes Company. All rights reserved. The information contained in this document is confidential and proprietary property of Baker Hughes and its affiliates. It is to be used only for the benefit of Baker Hughes and may not be distributed, transmitted, reproduced, altered, or used for any purpose without the express written consent of Baker Hughes. Baker Hughes & Net Power September 2024
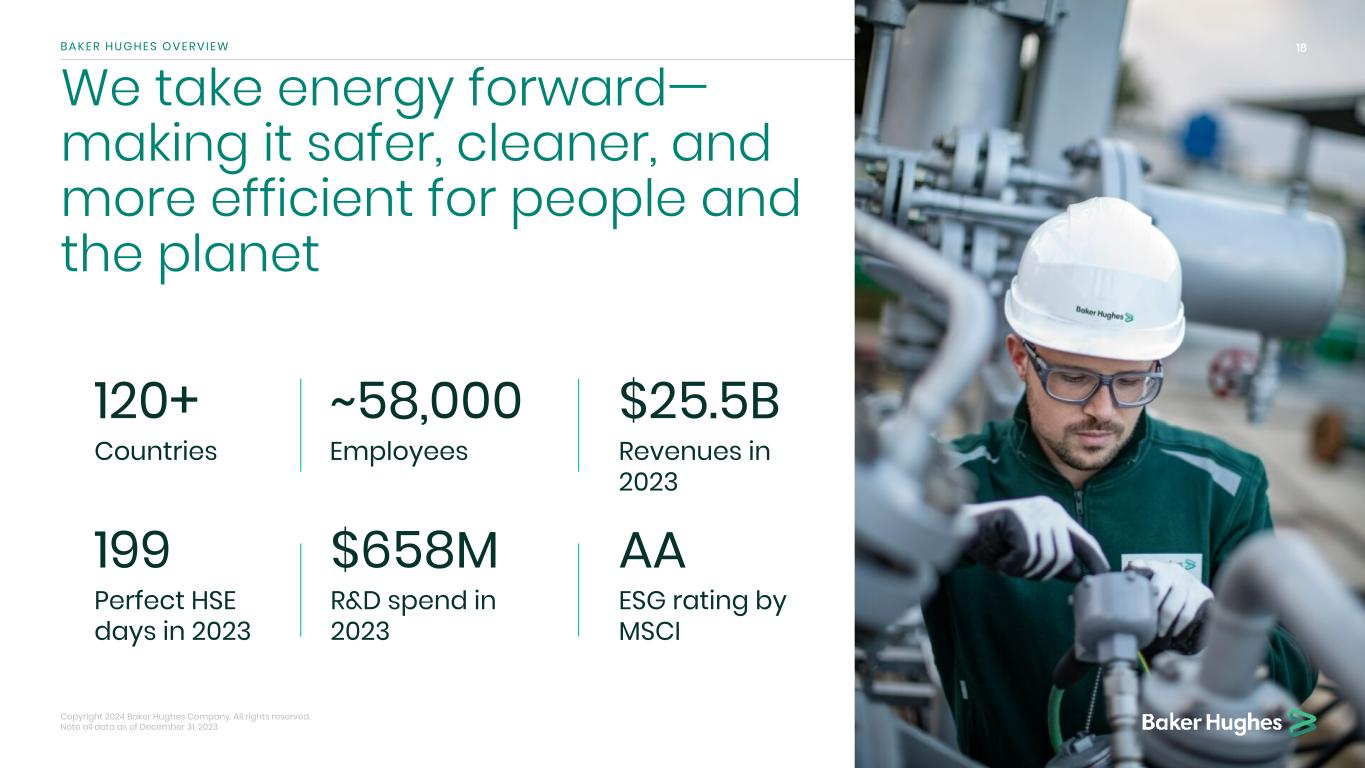
Copyright 2024 Baker Hughes Company. All rights reserved. Note all data as of December 31, 2023 B A K E R H U G H E S O V E R V I E W We take energy forward— making it safer, cleaner, and more efficient for people and the planet ~58,000 Employees 199 Perfect HSE days in 2023 120+ Countries $658M R&D spend in 2023 $25.5B Revenues in 2023 AA ESG rating by MSCI 18
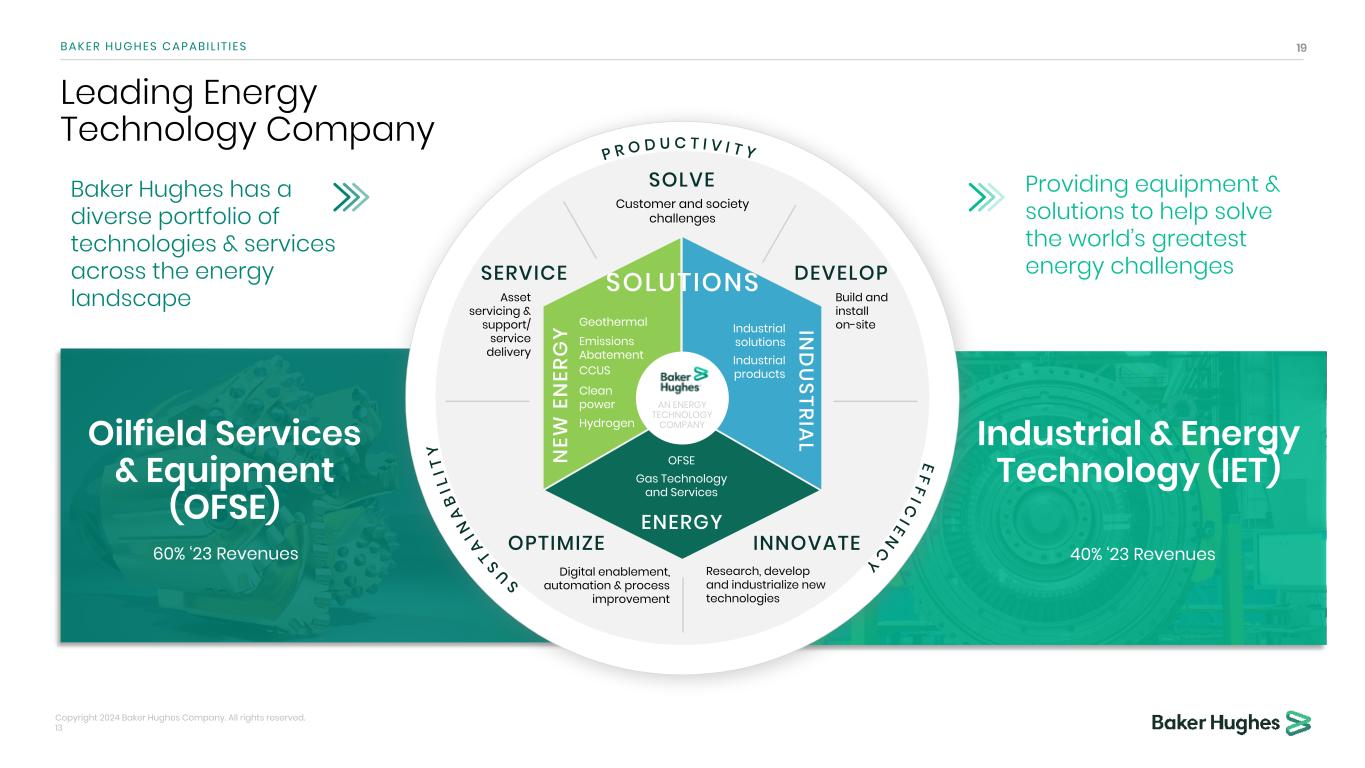
Copyright 2024 Baker Hughes Company. All rights reserved. 13 B A K E R H U G H E S C A P A B I L I T I E S Providing equipment & solutions to help solve the world’s greatest energy challenges Leading Energy Technology Company Baker Hughes has a diverse portfolio of technologies & services across the energy landscape Oilfield Services & Equipment (OFSE) Industrial & Energy Technology (IET) 19 Industrial Products Subsea & Surface Pressure Systems INNOVATEOPTIMIZE SERVICE Research, develop and industrialize new technologies Build and install on-site Asset servicing & support/ service delivery Digital enablement, automation & process improvement SOLVE ENERGY N EW E N ER G Y IN D U STRIA L OFSE Industrial solutions Geothermal AN ENERGY TECHNOLOGY COMPANY SOLUTIONS DEVELOP Industrial products Emissions Abatement Clean power Hydrogen CCUS Gas Technology and Services Customer and society challenges 60% ‘23 Revenues 40% ‘23 Revenues
20B A K E R H U G H E S A N D N E T P O W E R We are both an investor and technology partner Copyright 2024 Baker Hughes Company. All rights reserved. Net Power: a strategic solution within Baker Hughes’ broader Climate Technology Solutions portfolio INVESTMENT THESIS Net Power solution offers opportunity to tap into 200T m3 of proven gas reserves for next 50 years Solution provides access to utility-scale and industrial power generation space 20 Natural gas is a transition and destination lower carbon fuel Technology capabilities required by Net Power solution are complementary to Baker Hughes’ core domain expertise in turbomachinery and complex technology project development
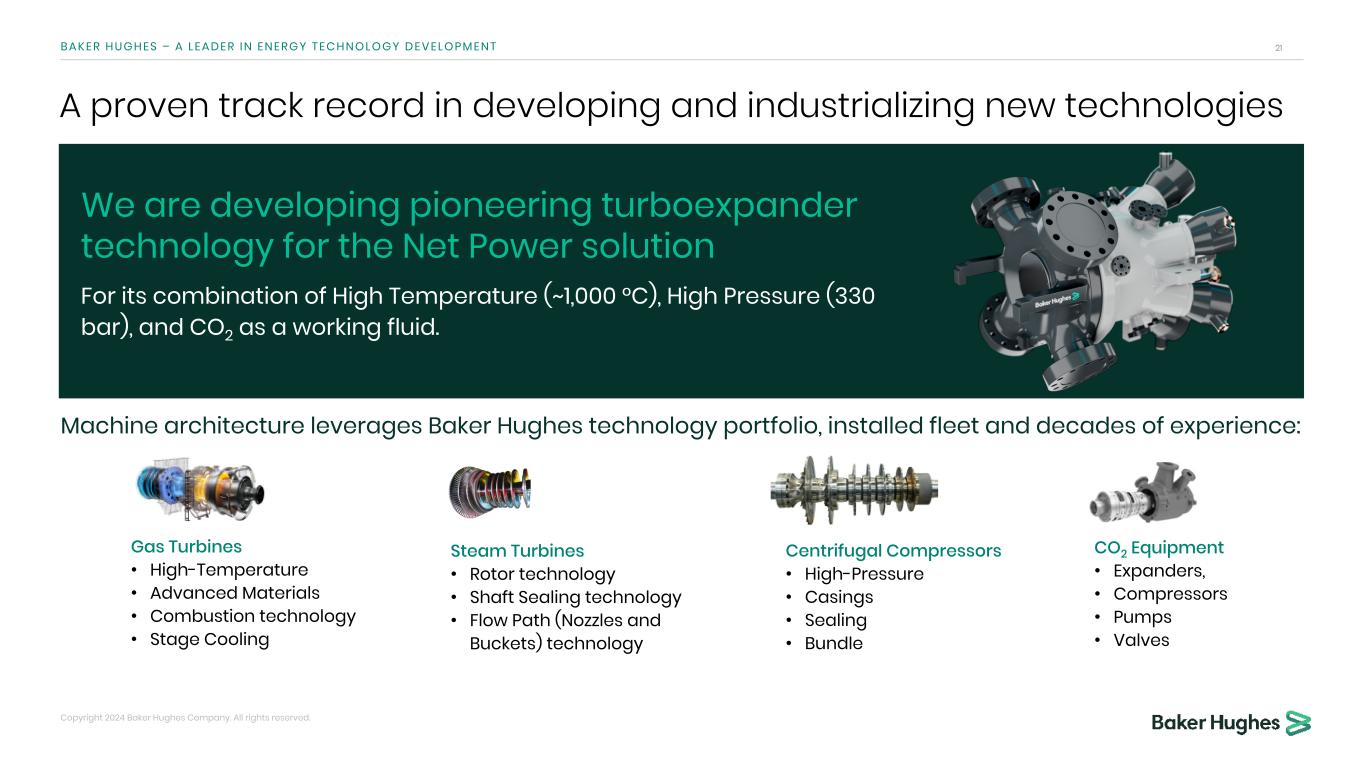
A proven track record in developing and industrializing new technologies 21B A K E R H U G H E S – A L E A D E R I N E N E R G Y T E C H N O L O G Y D E V E L O P M E N T We are developing pioneering turboexpander technology for the Net Power solution For its combination of High Temperature (~1,000 °C), High Pressure (330 bar), and CO2 as a working fluid. Gas Turbines • High-Temperature • Advanced Materials • Combustion technology • Stage Cooling Machine architecture leverages Baker Hughes technology portfolio, installed fleet and decades of experience: Steam Turbines • Rotor technology • Shaft Sealing technology • Flow Path (Nozzles and Buckets) technology Centrifugal Compressors • High-Pressure • Casings • Sealing • Bundle CO2 Equipment • Expanders, • Compressors • Pumps • Valves Copyright 2024 Baker Hughes Company. All rights reserved.
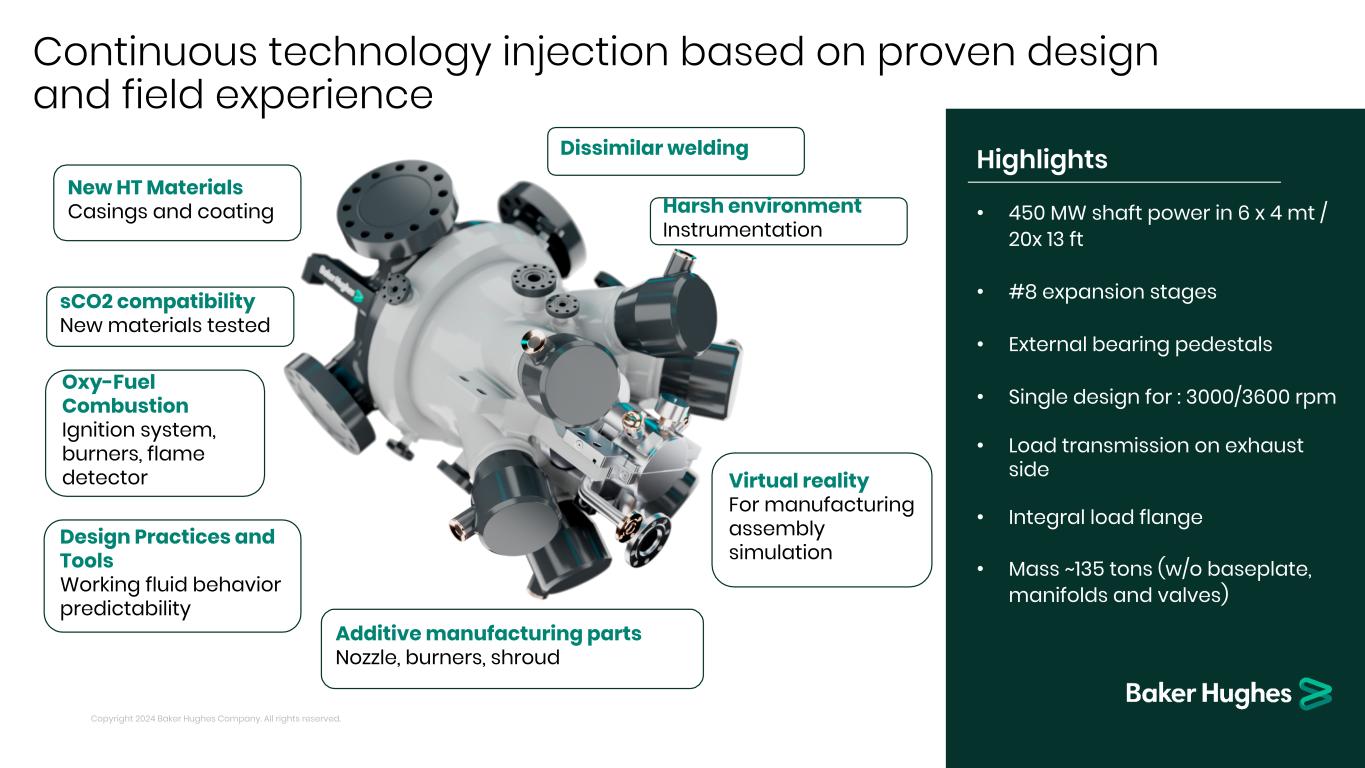
Highlights • 450 MW shaft power in 6 x 4 mt / 20x 13 ft • #8 expansion stages • External bearing pedestals • Single design for : 3000/3600 rpm • Load transmission on exhaust side • Integral load flange • Mass ~135 tons (w/o baseplate, manifolds and valves) Copyright 2024 Baker Hughes Company. All rights reserved. Oxy-Fuel Combustion Ignition system, burners, flame detector Virtual reality For manufacturing assembly simulation Additive manufacturing parts Nozzle, burners, shroud New HT Materials Casings and coating sCO2 compatibility New materials tested Dissimilar welding Harsh environment Instrumentation Design Practices and Tools Working fluid behavior predictability Continuous technology injection based on proven design and field experience
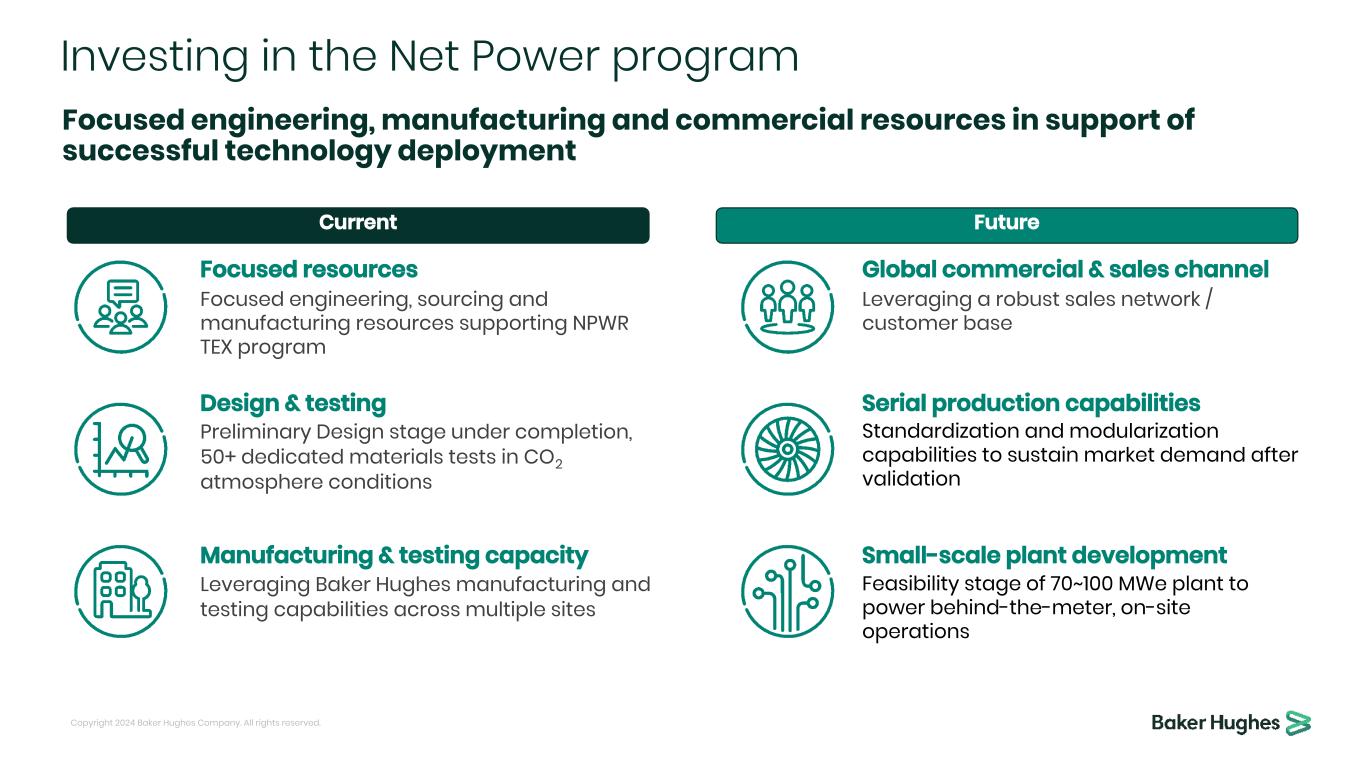
Investing in the Net Power program Focused engineering, sourcing and manufacturing resources supporting NPWR TEX program Focused resources Standardization and modularization capabilities to sustain market demand after validation Serial production capabilities Leveraging Baker Hughes manufacturing and testing capabilities across multiple sites Manufacturing & testing capacity Leveraging a robust sales network / customer base Global commercial & sales channel Feasibility stage of 70~100 MWe plant to power behind-the-meter, on-site operations Small-scale plant development Focused engineering, manufacturing and commercial resources in support of successful technology deployment Current Future Design & testing Preliminary Design stage under completion, 50+ dedicated materials tests in CO2 atmosphere conditions Copyright 2024 Baker Hughes Company. All rights reserved.
24B A K E R H U G H E S A N D N E T P O W E R In summary A solution to enable decarbonization of Utility, Oil & Gas and Heavy Industry applications Solution applicable across multiple industry verticals Continued demand for gas with low emissions A winning partnership Securing customer interest across regions leveraging different policy incentives Copyright 2024 Baker Hughes Company. All rights reserved.

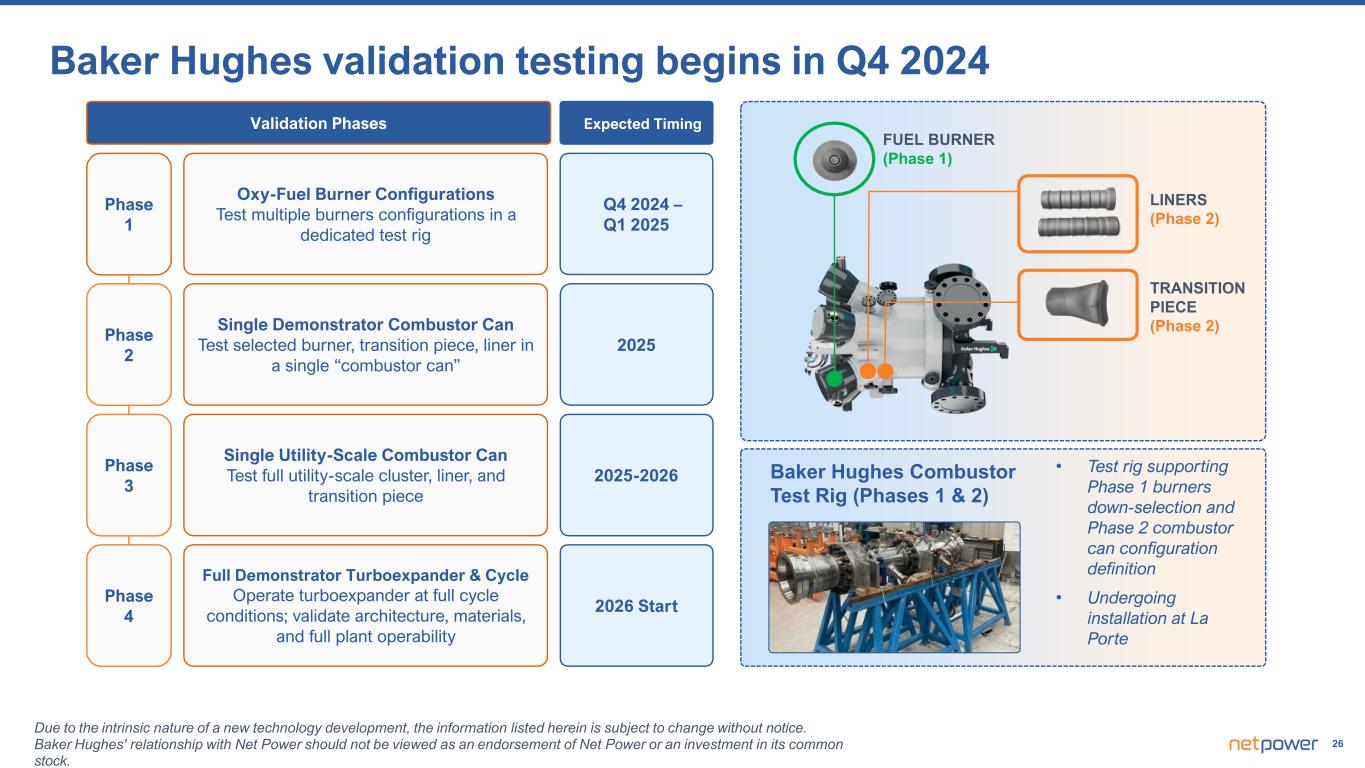
26 Expected TimingValidation Phases Single Utility-Scale Combustor Can Test full utility-scale cluster, liner, and transition piece Full Demonstrator Turboexpander & Cycle Operate turboexpander at full cycle conditions; validate architecture, materials, and full plant operability Single Demonstrator Combustor Can Test selected burner, transition piece, liner in a single “combustor can” Oxy-Fuel Burner Configurations Test multiple burners configurations in a dedicated test rig Phase 1 Phase 2 Phase 3 Phase 4 2026 Start 2025-2026 2025 Q4 2024 – Q1 2025 • Test rig supporting Phase 1 burners down-selection and Phase 2 combustor can configuration definition • Undergoing installation at La Porte Due to the intrinsic nature of a new technology development, the information listed herein is subject to change without notice. Baker Hughes' relationship with Net Power should not be viewed as an endorsement of Net Power or an investment in its common stock. Baker Hughes validation testing begins in Q4 2024 Baker Hughes Combustor Test Rig (Phases 1 & 2) FUEL BURNER (Phase 1) LINERS (Phase 2) TRANSITION PIECE (Phase 2)
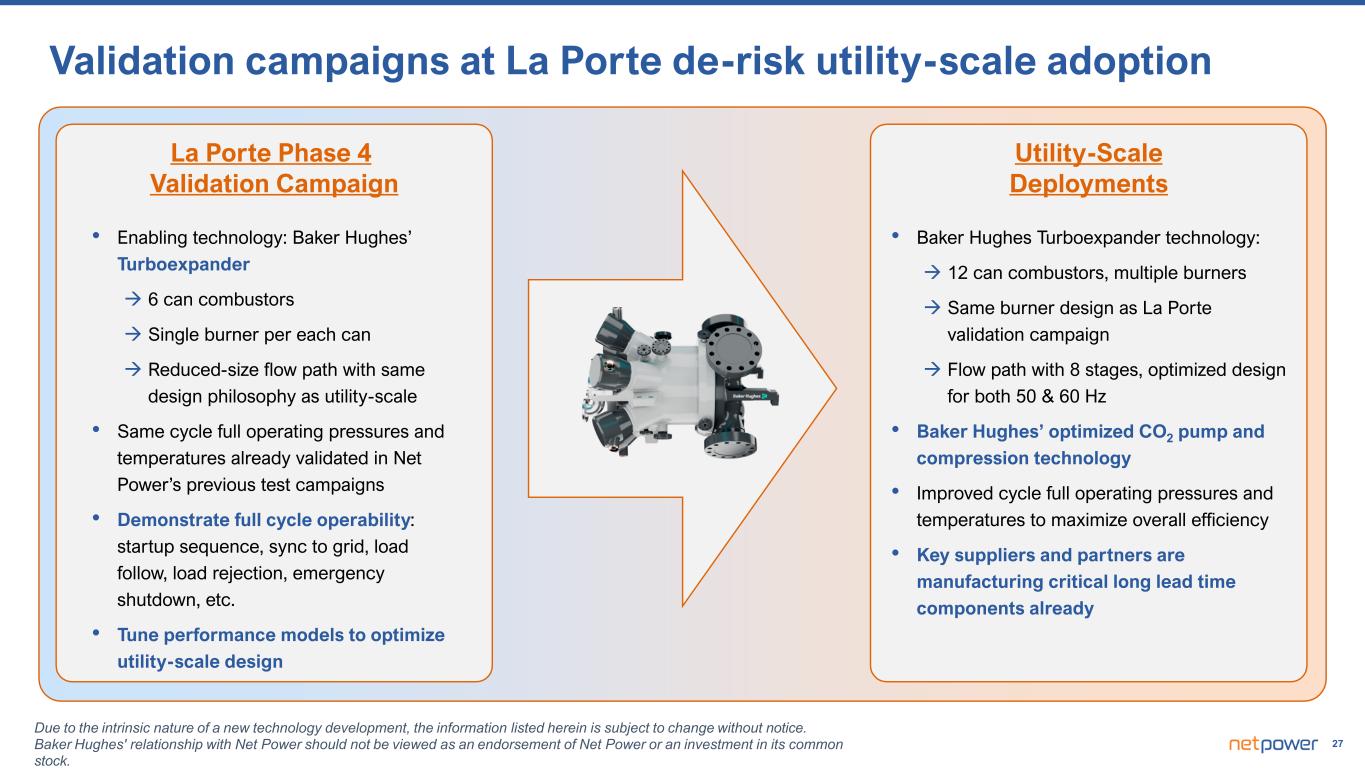
27 Validation campaigns at La Porte de-risk utility-scale adoption La Porte Phase 4 Validation Campaign • Enabling technology: Baker Hughes’ Turboexpander 6 can combustors Single burner per each can Reduced-size flow path with same design philosophy as utility-scale • Same cycle full operating pressures and temperatures already validated in Net Power’s previous test campaigns • Demonstrate full cycle operability: startup sequence, sync to grid, load follow, load rejection, emergency shutdown, etc. • Tune performance models to optimize utility-scale design Utility-Scale Deployments • Baker Hughes Turboexpander technology: 12 can combustors, multiple burners Same burner design as La Porte validation campaign Flow path with 8 stages, optimized design for both 50 & 60 Hz • Baker Hughes’ optimized CO2 pump and compression technology • Improved cycle full operating pressures and temperatures to maximize overall efficiency • Key suppliers and partners are manufacturing critical long lead time components already Due to the intrinsic nature of a new technology development, the information listed herein is subject to change without notice. Baker Hughes' relationship with Net Power should not be viewed as an endorsement of Net Power or an investment in its common stock.
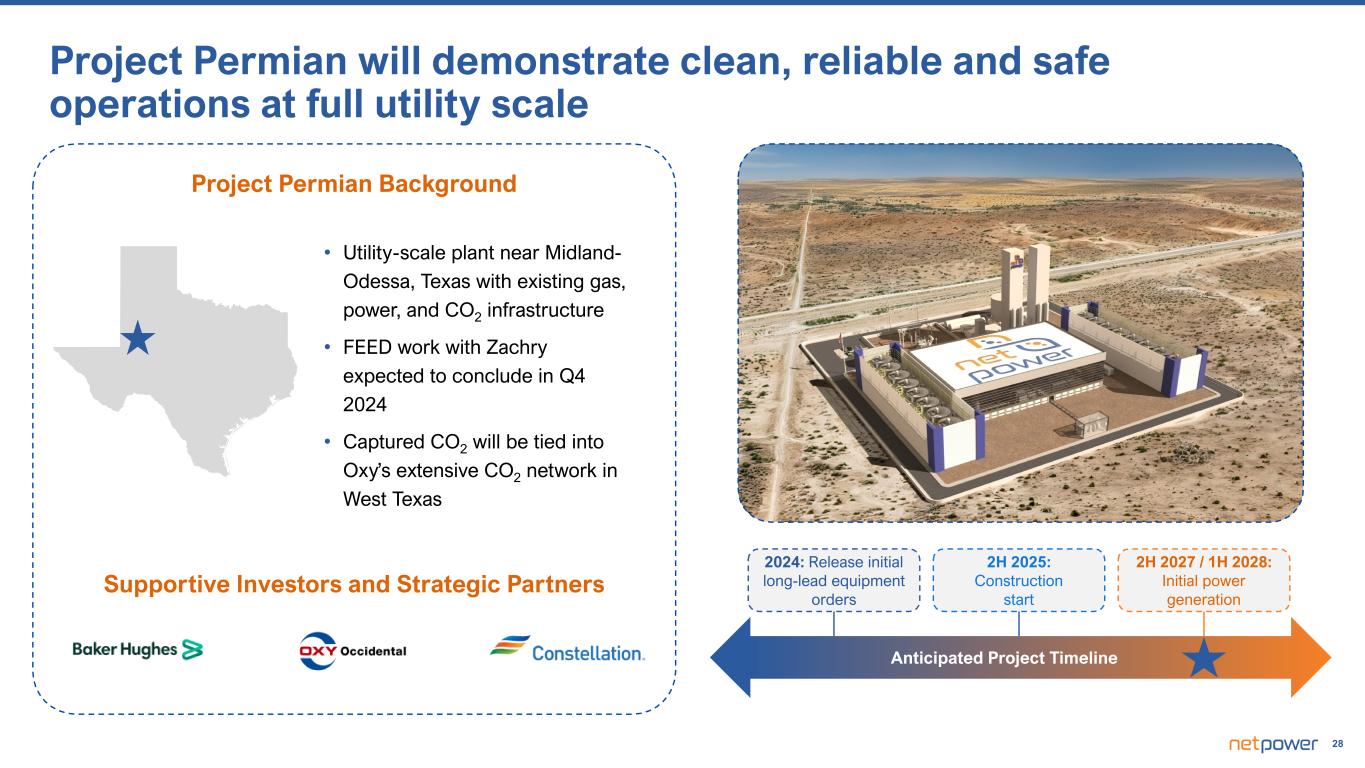
28 2024: Release initial long-lead equipment orders 2H 2027 / 1H 2028: Initial power generation Project Permian Background • Utility-scale plant near Midland- Odessa, Texas with existing gas, power, and CO2 infrastructure • FEED work with Zachry expected to conclude in Q4 2024 • Captured CO2 will be tied into Oxy’s extensive CO2 network in West Texas Supportive Investors and Strategic Partners Project Permian will demonstrate clean, reliable and safe operations at full utility scale Anticipated Project Timeline 2H 2025: Construction start
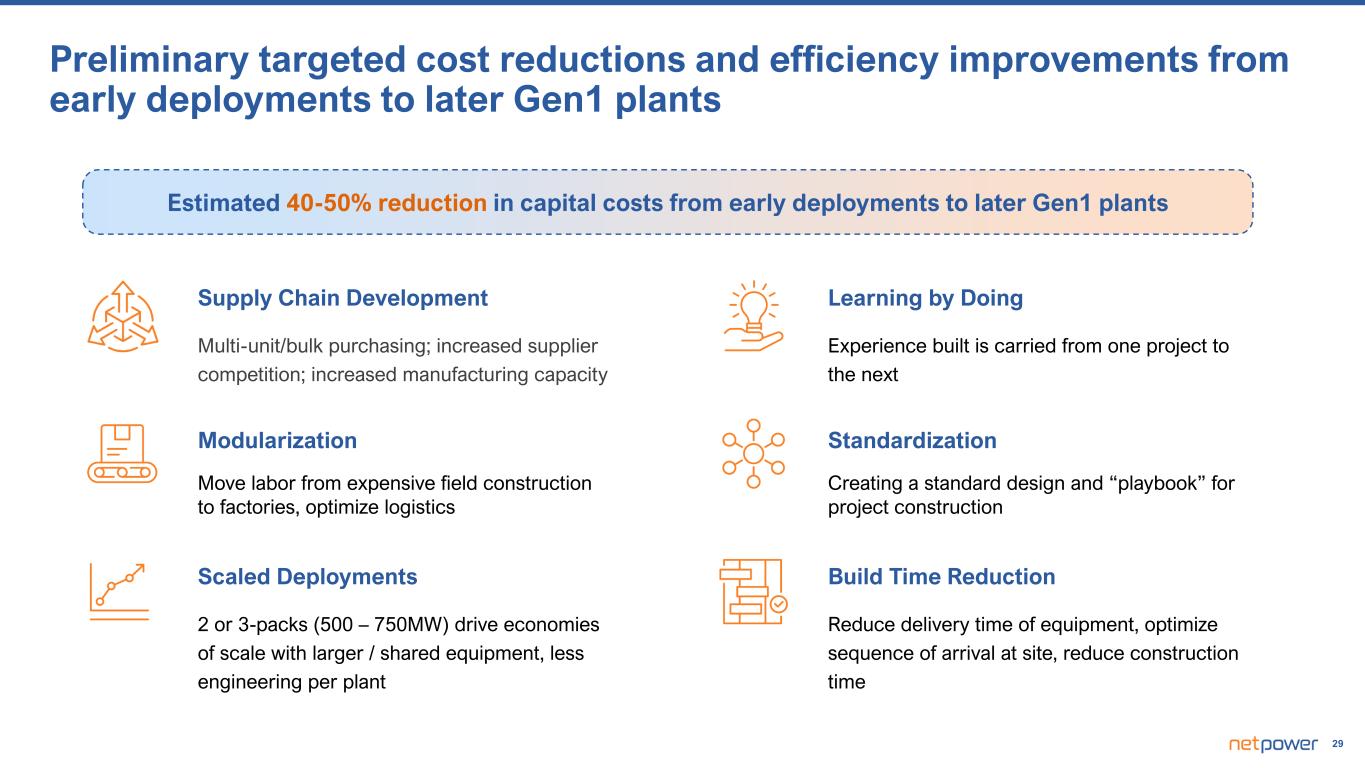
29 Preliminary targeted cost reductions and efficiency improvements from early deployments to later Gen1 plants Multi-unit/bulk purchasing; increased supplier competition; increased manufacturing capacity Supply Chain Development Move labor from expensive field construction to factories, optimize logistics Modularization 2 or 3-packs (500 – 750MW) drive economies of scale with larger / shared equipment, less engineering per plant Scaled Deployments Experience built is carried from one project to the next Learning by Doing Creating a standard design and “playbook” for project construction Standardization Reduce delivery time of equipment, optimize sequence of arrival at site, reduce construction time Build Time Reduction Estimated 40-50% reduction in capital costs from early deployments to later Gen1 plants
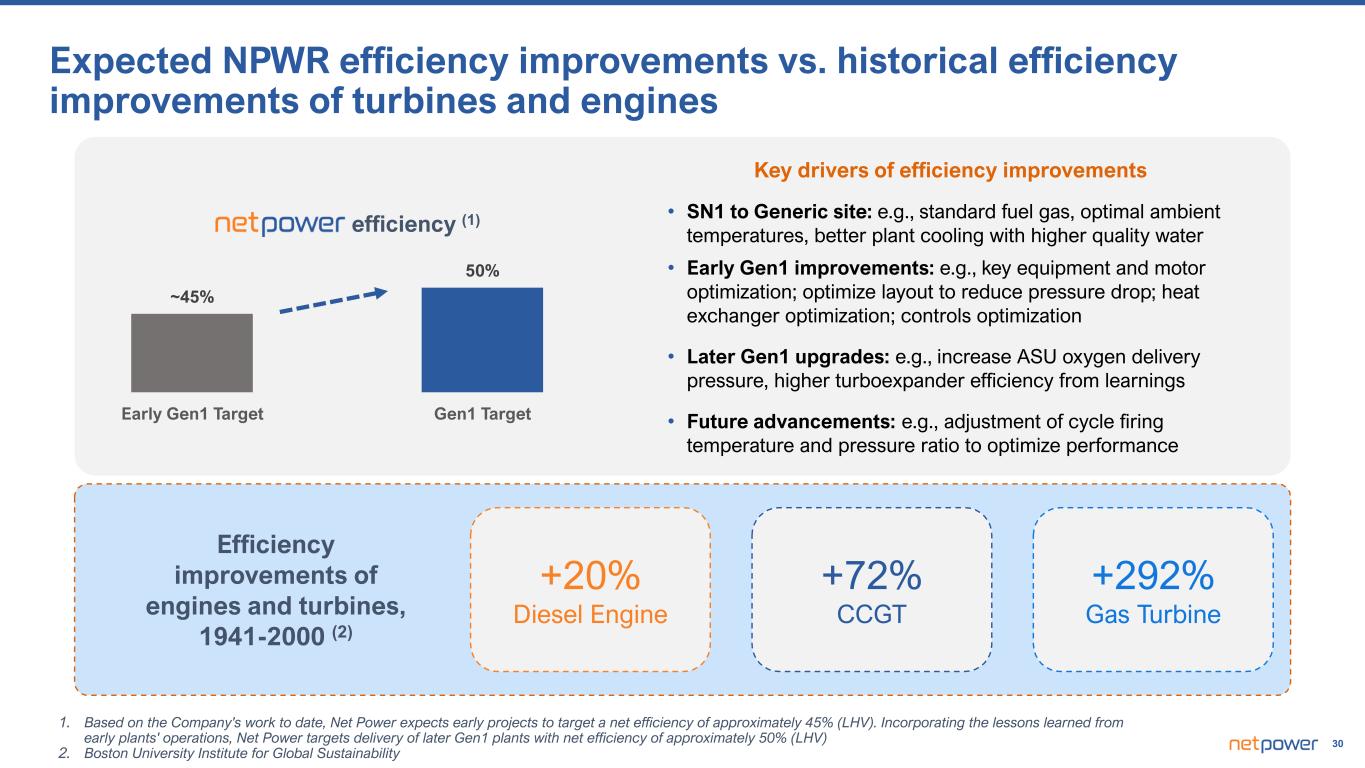
30 Early Gen1 Target Gen1 Target ~45% 50% 1. Based on the Company's work to date, Net Power expects early projects to target a net efficiency of approximately 45% (LHV). Incorporating the lessons learned from early plants' operations, Net Power targets delivery of later Gen1 plants with net efficiency of approximately 50% (LHV) 2. Boston University Institute for Global Sustainability Expected NPWR efficiency improvements vs. historical efficiency improvements of turbines and engines Efficiency improvements of engines and turbines, 1941-2000 (2) +292% Gas Turbine +20% Diesel Engine +72% CCGT efficiency (1) Key drivers of efficiency improvements • SN1 to Generic site: e.g., standard fuel gas, optimal ambient temperatures, better plant cooling with higher quality water • Early Gen1 improvements: e.g., key equipment and motor optimization; optimize layout to reduce pressure drop; heat exchanger optimization; controls optimization • Later Gen1 upgrades: e.g., increase ASU oxygen delivery pressure, higher turboexpander efficiency from learnings • Future advancements: e.g., adjustment of cycle firing temperature and pressure ratio to optimize performance
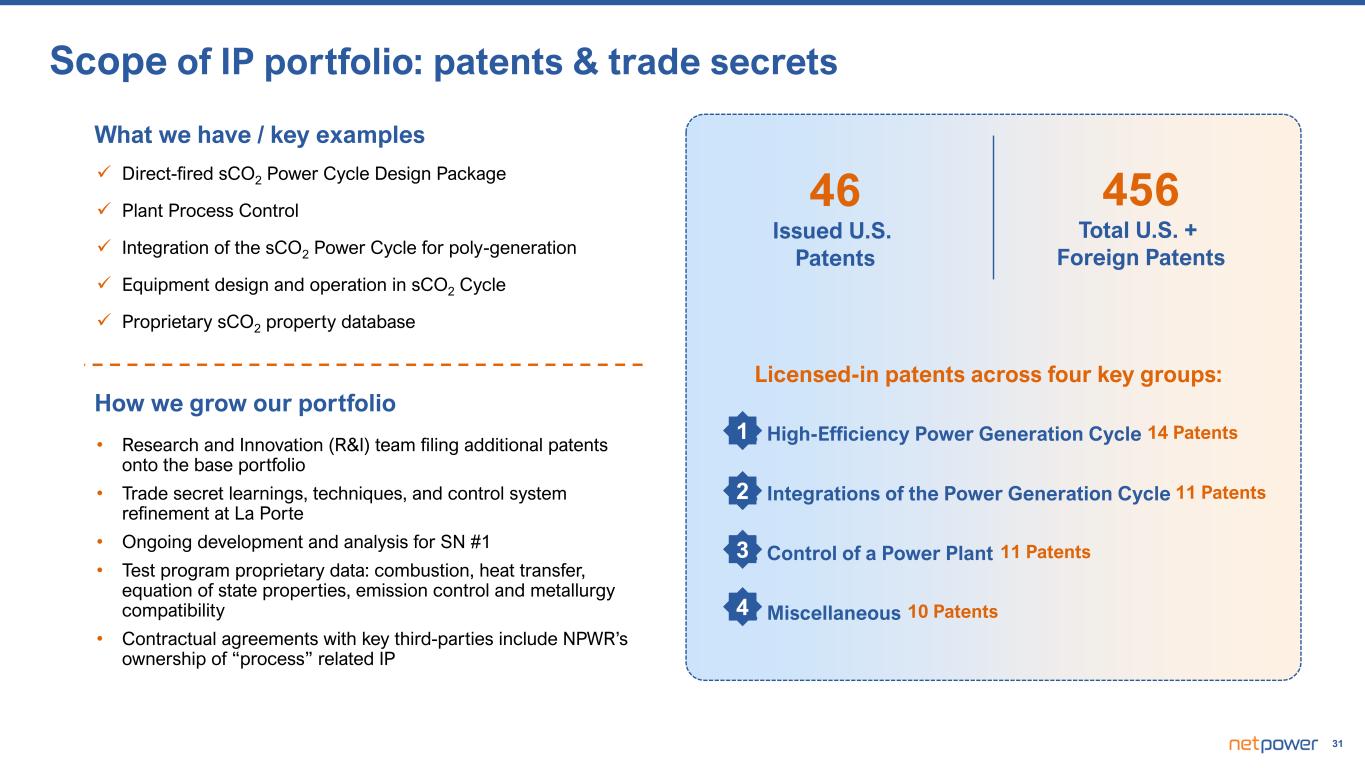
31 1. High-Efficiency Power Generation Cycle 2. Integrations of the Power Generation Cycle 3. Control of a Power Plant 4. Miscellaneous 1 2 3 4 What we have / key examples Direct-fired sCO2 Power Cycle Design Package Plant Process Control Integration of the sCO2 Power Cycle for poly-generation Equipment design and operation in sCO2 Cycle Proprietary sCO2 property database How we grow our portfolio • Research and Innovation (R&I) team filing additional patents onto the base portfolio • Trade secret learnings, techniques, and control system refinement at La Porte • Ongoing development and analysis for SN #1 • Test program proprietary data: combustion, heat transfer, equation of state properties, emission control and metallurgy compatibility • Contractual agreements with key third-parties include NPWR’s ownership of “process” related IP 46 Issued U.S. Patents 456 Total U.S. + Foreign Patents Licensed-in patents across four key groups: 14 Patents 11 Patents 11 Patents 10 Patents Scope of IP portfolio: patents & trade secrets
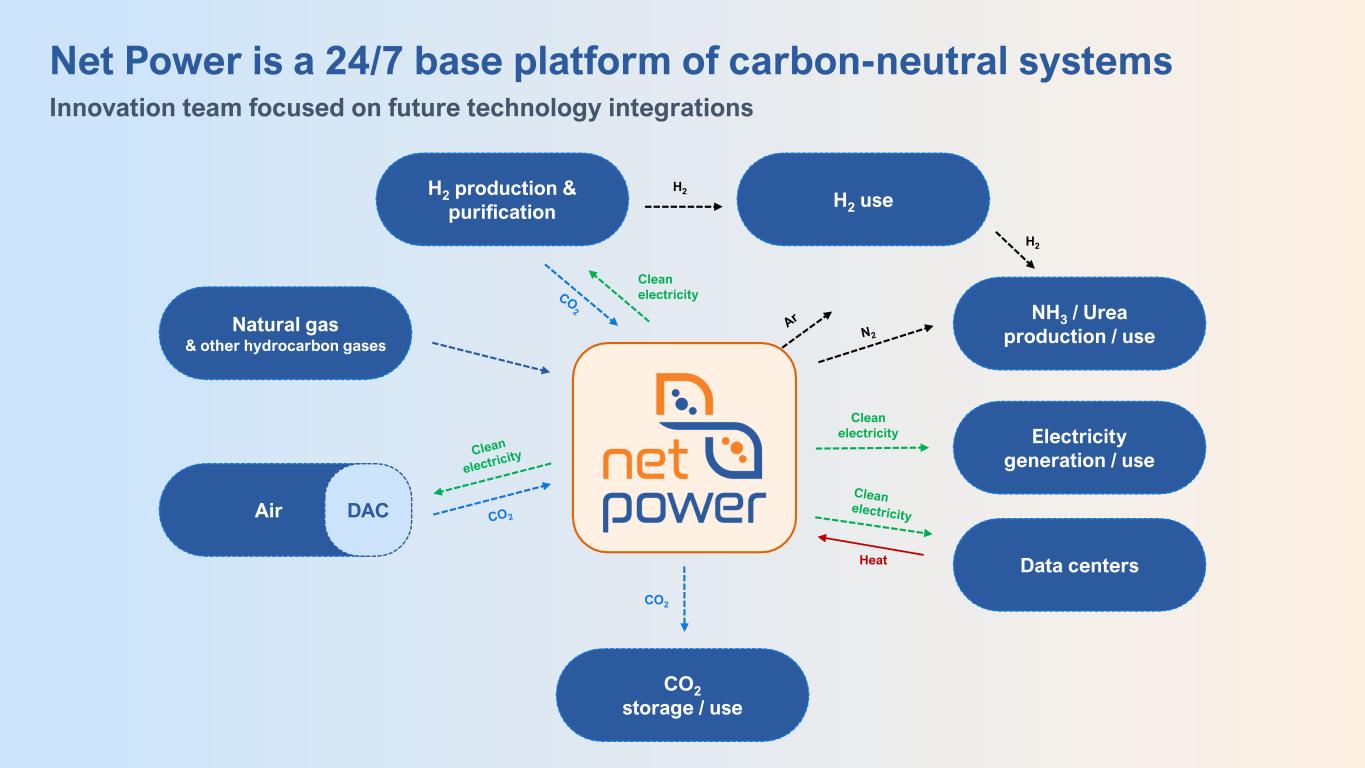
32 Air H2 use NH3 / Urea production / use Data centers Natural gas & other hydrocarbon gases H2 production & purification DAC Heat Clean electricity Clean electricity CO2 CO2 storage / use Electricity generation / use N2 Ar H2 H2 Clean electricity Net Power is a 24/7 base platform of carbon-neutral systems CO2 Clean electricity Innovation team focused on future technology integrations CO 2

33 Commercial Development
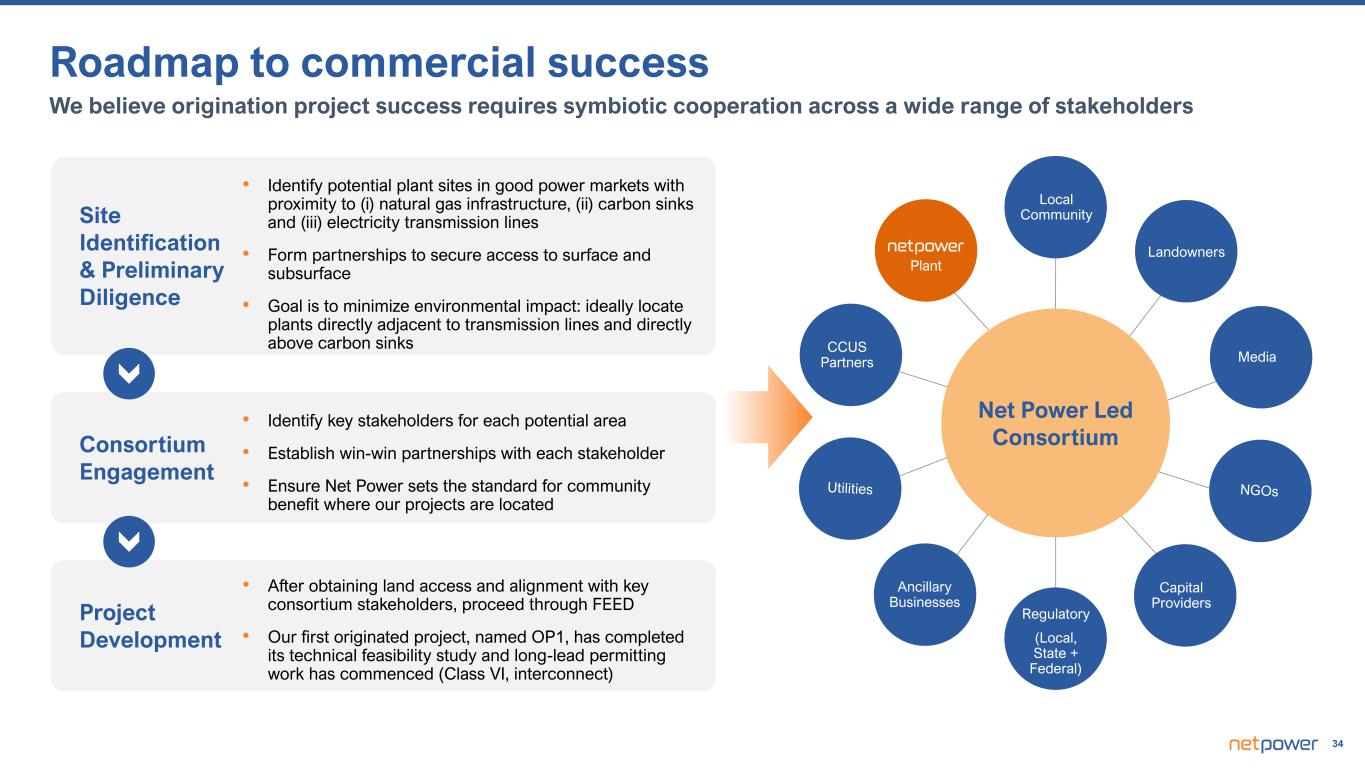
34 Roadmap to commercial success We believe origination project success requires symbiotic cooperation across a wide range of stakeholders Site Identification & Preliminary Diligence • Identify potential plant sites in good power markets with proximity to (i) natural gas infrastructure, (ii) carbon sinks and (iii) electricity transmission lines • Form partnerships to secure access to surface and subsurface • Goal is to minimize environmental impact: ideally locate plants directly adjacent to transmission lines and directly above carbon sinks Consortium Engagement • Identify key stakeholders for each potential area • Establish win-win partnerships with each stakeholder • Ensure Net Power sets the standard for community benefit where our projects are located Project Development • After obtaining land access and alignment with key consortium stakeholders, proceed through FEED • Our first originated project, named OP1, has completed its technical feasibility study and long-lead permitting work has commenced (Class VI, interconnect) Net Power Led Consortium Local Community Regulatory (Local, State + Federal) Landowners Ancillary Businesses Media Utilities NGOs CCUS Partners Plant Capital Providers
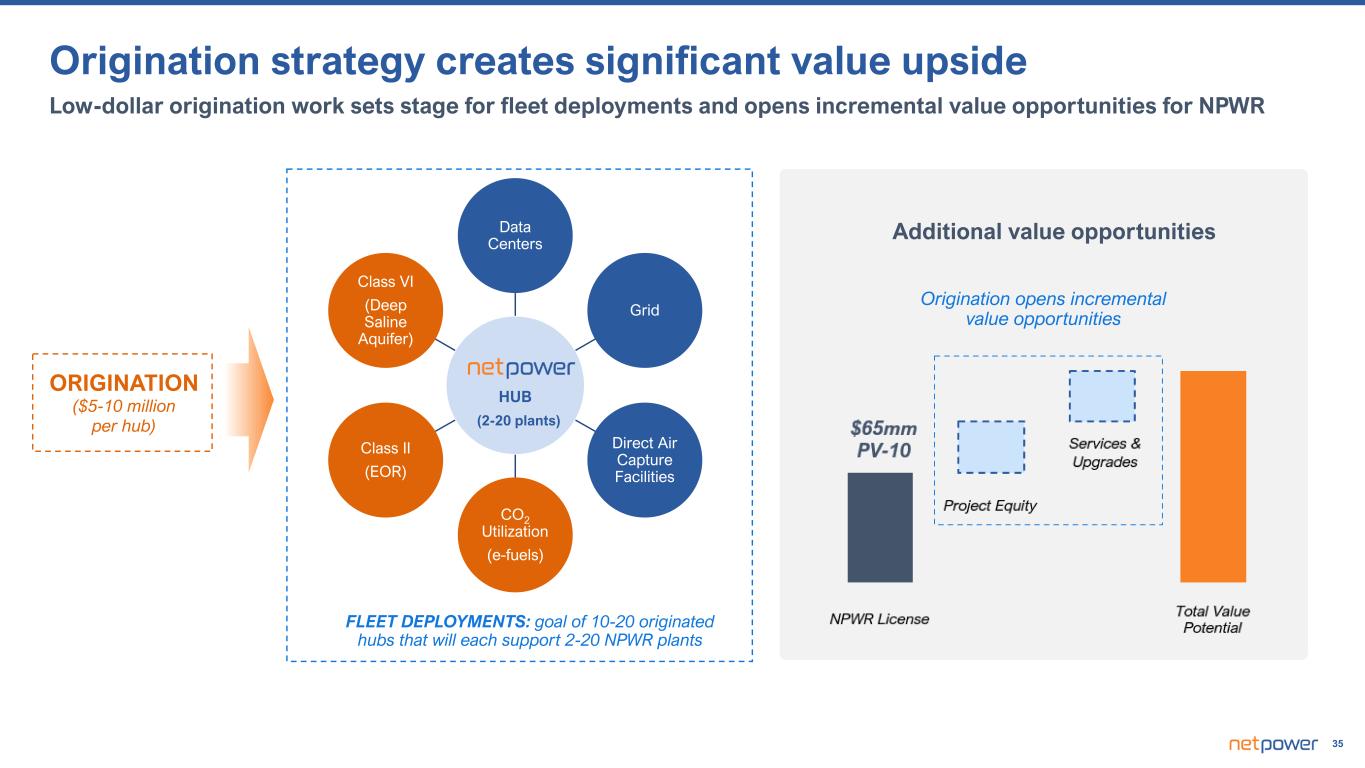
35 ORIGINATION ($5-10 million per hub) Origination opens incremental value opportunities Additional value opportunities Origination strategy creates significant value upside Low-dollar origination work sets stage for fleet deployments and opens incremental value opportunities for NPWR HUB Data Centers Grid Direct Air Capture Facilities CO2 Utilization (e-fuels) Class II (EOR) Class VI (Deep Saline Aquifer) (2-20 plants) FLEET DEPLOYMENTS: goal of 10-20 originated hubs that will each support 2-20 NPWR plants
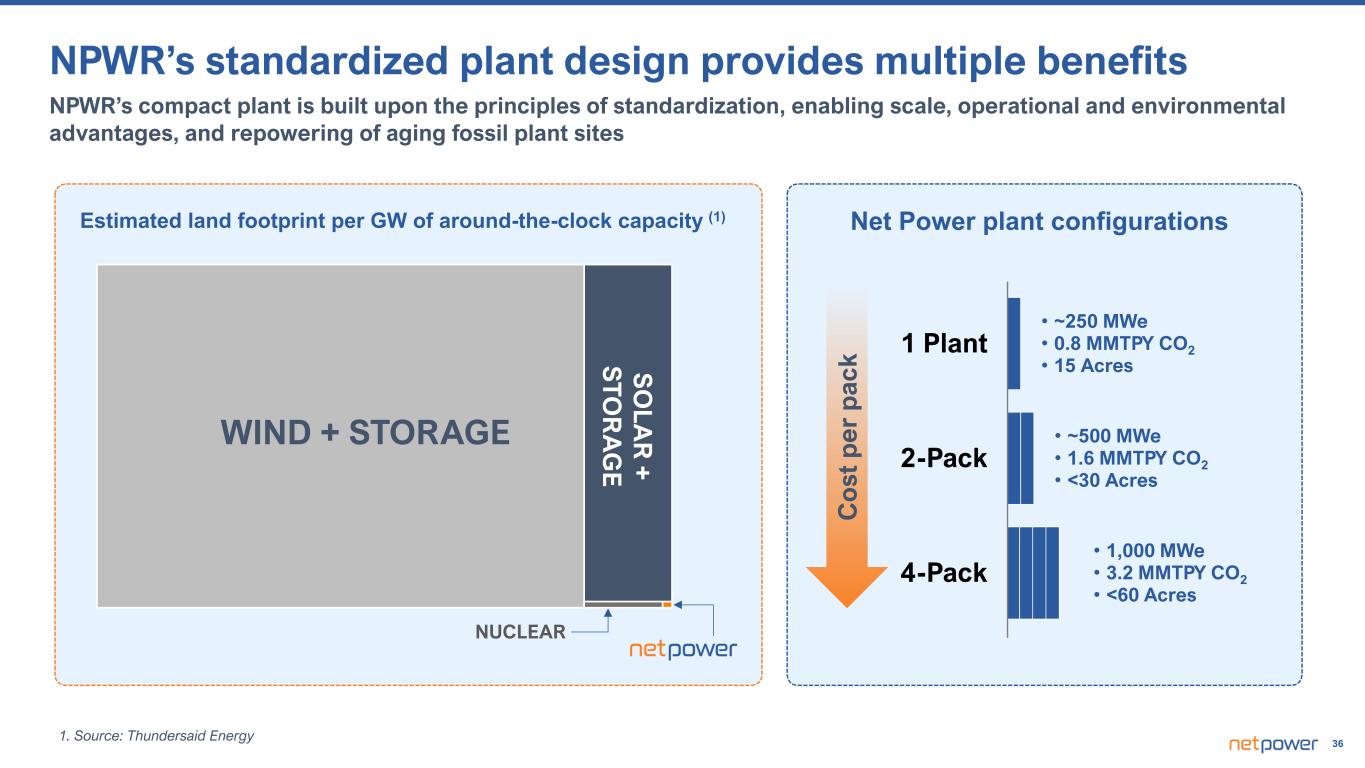
36 1. Source: Thundersaid Energy Net Power plant configurations • ~250 MWe • 0.8 MMTPY CO2 • 15 Acres • ~500 MWe • 1.6 MMTPY CO2 • <30 Acres • 1,000 MWe • 3.2 MMTPY CO2 • <60 Acres 1 Plant 2-Pack 4-Pack WIND + STORAGE S O LA R + S TO R A G E Estimated land footprint per GW of around-the-clock capacity (1) NUCLEAR NPWR’s standardized plant design provides multiple benefits NPWR’s compact plant is built upon the principles of standardization, enabling scale, operational and environmental advantages, and repowering of aging fossil plant sites C o st p er p ac k
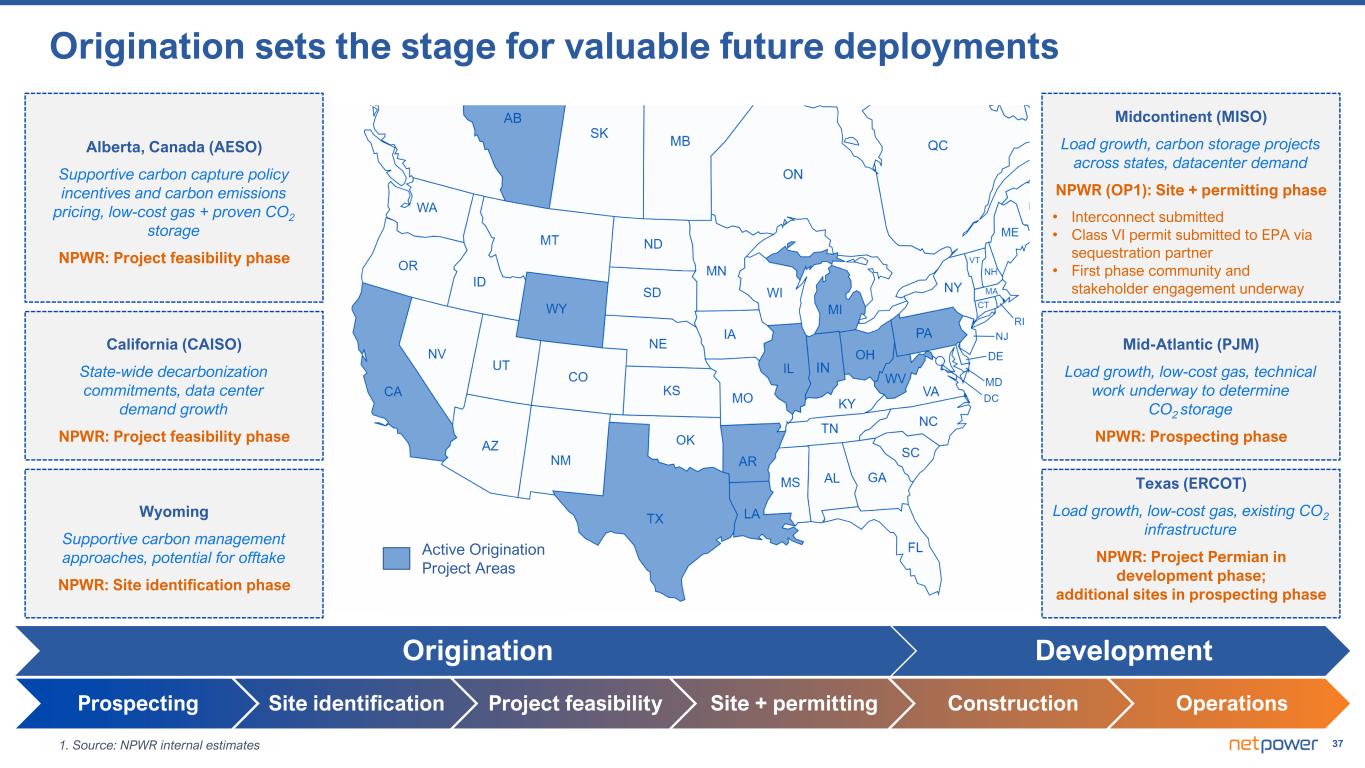
371. Source: NPWR internal estimates Alberta, Canada (AESO) Supportive carbon capture policy incentives and carbon emissions pricing, low-cost gas + proven CO2 storage NPWR: Project feasibility phase Wyoming Supportive carbon management approaches, potential for offtake NPWR: Site identification phase California (CAISO) State-wide decarbonization commitments, data center demand growth NPWR: Project feasibility phase Midcontinent (MISO) Load growth, carbon storage projects across states, datacenter demand NPWR (OP1): Site + permitting phase • Interconnect submitted • Class VI permit submitted to EPA via sequestration partner • First phase community and stakeholder engagement underway Mid-Atlantic (PJM) Load growth, low-cost gas, technical work underway to determine CO2 storage NPWR: Prospecting phase Texas (ERCOT) Load growth, low-cost gas, existing CO2 infrastructure NPWR: Project Permian in development phase; additional sites in prospecting phase Prospecting Site identification Project feasibility Site + permitting Construction Operations Origination Development Active Origination Project Areas Origination sets the stage for valuable future deployments

38 Plant Economics / Financial Updates
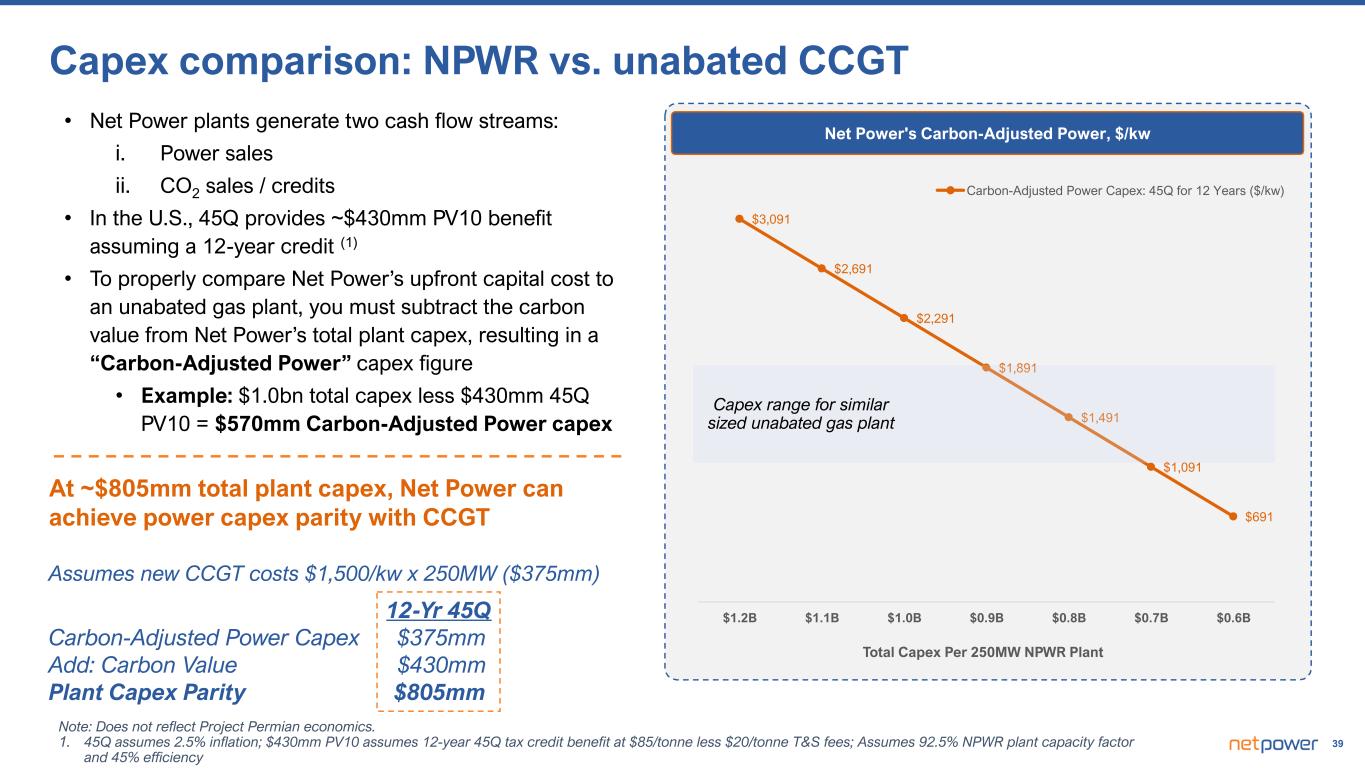
39 Total Capex Per 250MW NPWR Plant $1.2B $1.1B $1.0B $0.9B $0.8B $0.7B $0.6B $3,091 $2,691 $2,291 $1,891 $1,491 $1,091 $691 Carbon-Adjusted Power Capex: 45Q for 12 Years ($/kw) Note: Does not reflect Project Permian economics. 1. 45Q assumes 2.5% inflation; $430mm PV10 assumes 12-year 45Q tax credit benefit at $85/tonne less $20/tonne T&S fees; Assumes 92.5% NPWR plant capacity factor and 45% efficiency Capex comparison: NPWR vs. unabated CCGT • Net Power plants generate two cash flow streams: i. Power sales ii. CO2 sales / credits • In the U.S., 45Q provides ~$430mm PV10 benefit assuming a 12-year credit (1) • To properly compare Net Power’s upfront capital cost to an unabated gas plant, you must subtract the carbon value from Net Power’s total plant capex, resulting in a “Carbon-Adjusted Power” capex figure • Example: $1.0bn total capex less $430mm 45Q PV10 = $570mm Carbon-Adjusted Power capex At ~$805mm total plant capex, Net Power can achieve power capex parity with CCGT Assumes new CCGT costs $1,500/kw x 250MW ($375mm) 12-Yr 45Q Carbon-Adjusted Power Capex $375mm Add: Carbon Value $430mm Plant Capex Parity $805mm Net Power's Carbon-Adjusted Power, $/kw Capex range for similar sized unabated gas plant
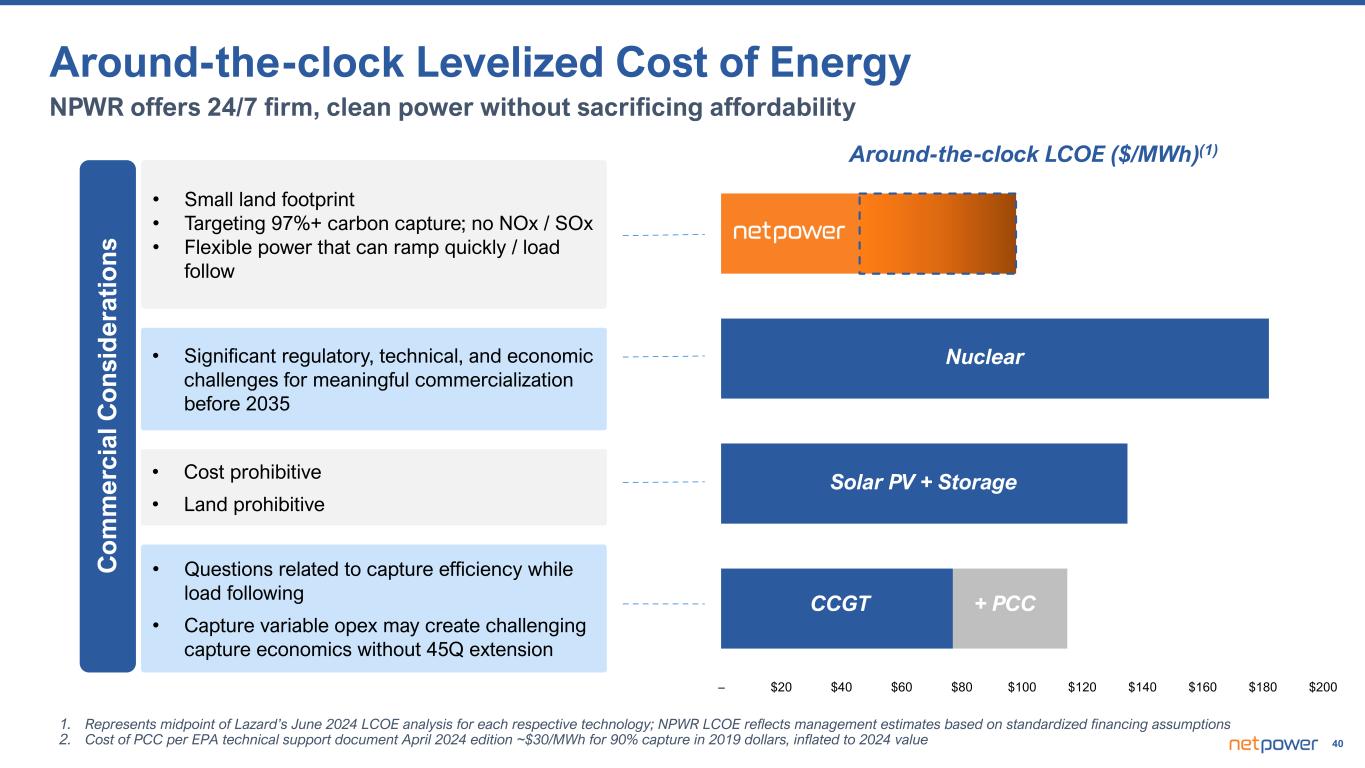
40 • Significant regulatory, technical, and economic challenges for meaningful commercialization before 2035 • Small land footprint • Targeting 97%+ carbon capture; no NOx / SOx • Flexible power that can ramp quickly / load follow 1. Represents midpoint of Lazard’s June 2024 LCOE analysis for each respective technology; NPWR LCOE reflects management estimates based on standardized financing assumptions 2. Cost of PCC per EPA technical support document April 2024 edition ~$30/MWh for 90% capture in 2019 dollars, inflated to 2024 value – $20 $40 $60 $80 $100 $120 $140 $160 $180 $200 Around-the-clock LCOE ($/MWh)(1) Nuclear Solar PV + Storage CCGT + PCC C o m m er ci al C o n si d er at io n s • Cost prohibitive • Land prohibitive • Questions related to capture efficiency while load following • Capture variable opex may create challenging capture economics without 45Q extension NPWR offers 24/7 firm, clean power without sacrificing affordability Around-the-clock Levelized Cost of Energy
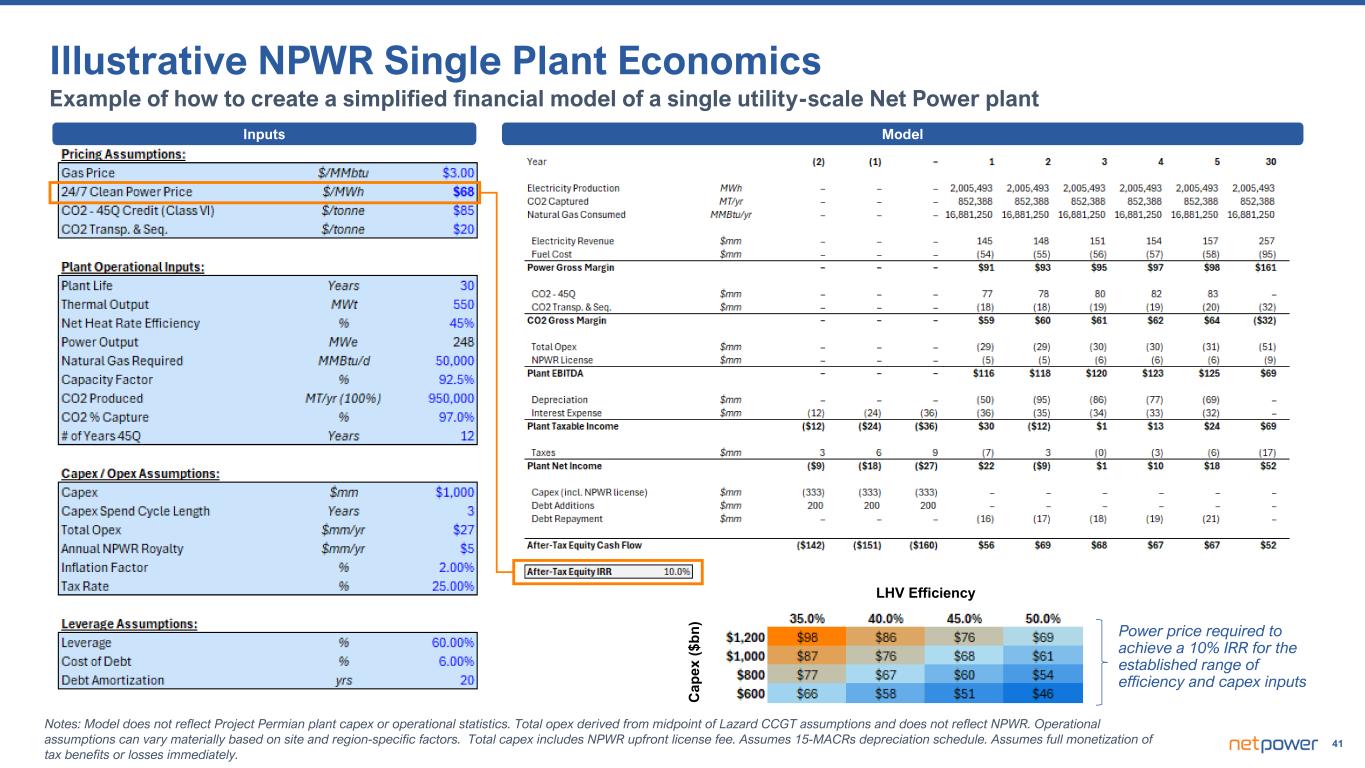
41 Notes: Model does not reflect Project Permian plant capex or operational statistics. Total opex derived from midpoint of Lazard CCGT assumptions and does not reflect NPWR. Operational assumptions can vary materially based on site and region-specific factors. Total capex includes NPWR upfront license fee. Assumes 15-MACRs depreciation schedule. Assumes full monetization of tax benefits or losses immediately. Illustrative NPWR Single Plant Economics Example of how to create a simplified financial model of a single utility-scale Net Power plant LHV Efficiency C ap ex ($ bn ) Power price required to achieve a 10% IRR for the established range of efficiency and capex inputs Inputs Model
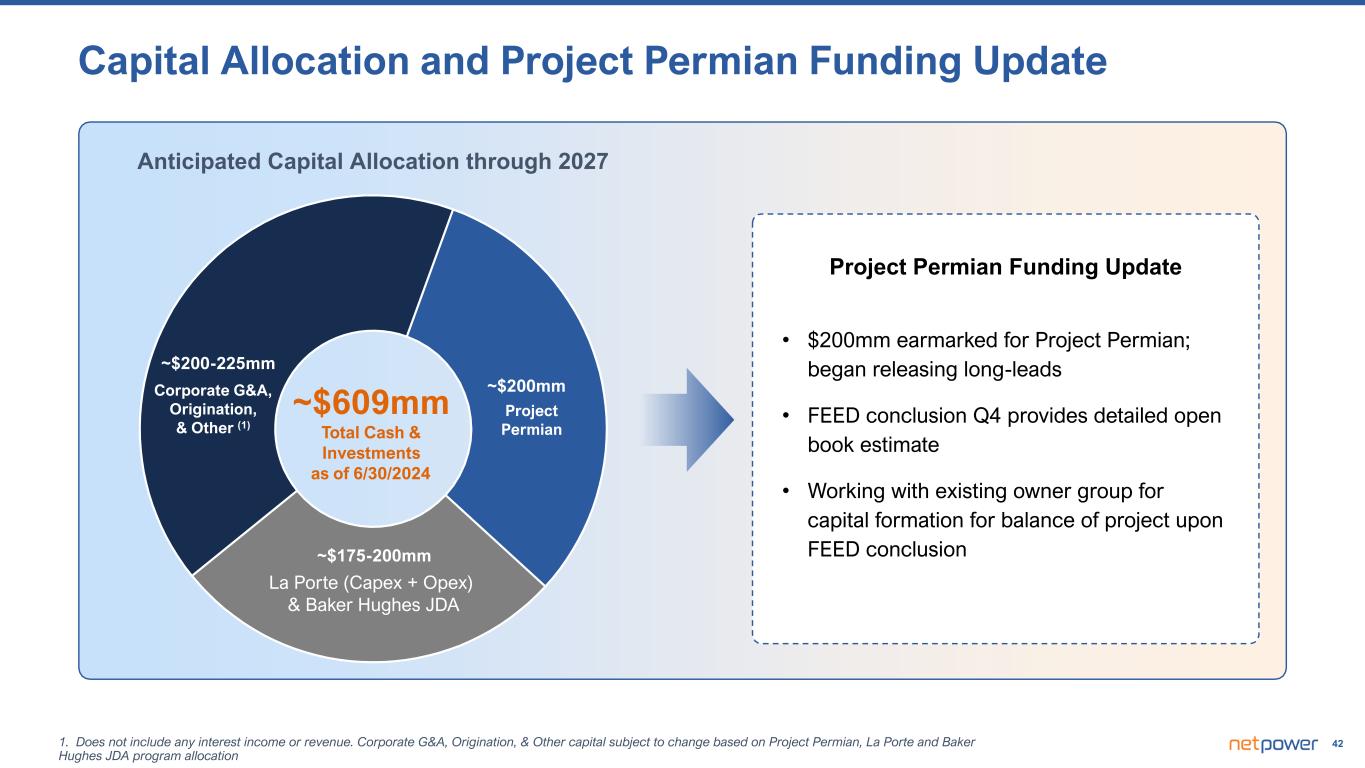
421. Does not include any interest income or revenue. Corporate G&A, Origination, & Other capital subject to change based on Project Permian, La Porte and Baker Hughes JDA program allocation • $200mm earmarked for Project Permian; began releasing long-leads • FEED conclusion Q4 provides detailed open book estimate • Working with existing owner group for capital formation for balance of project upon FEED conclusion La Porte (Capex + Opex) & Baker Hughes JDA Anticipated Capital Allocation through 2027 ~$609mm Total Cash & Investments as of 6/30/2024 Corporate G&A, Origination, & Other (1) ~$200mm ~$175-200mm ~$200-225mm Project Permian Capital Allocation and Project Permian Funding Update Project Permian Funding Update Missing footnotes

43power Q&A